Two Kinds of Office 365 Analytics – For You and The Company
Analytics for the Business
On July 5, Microsoft announced that Workplace Analytics is now available as an add-on for any Office 365 enterprise plan. The post says: “Workplace Analytics provides unprecedented behavioral insights that can be used to improve productivity, workforce effectiveness and employee engagement.”
Sounds good, but let’s be clear. Workplace Analytics is not something like Teams or Groups that an organization can deploy reasonably simply. This is a full-blown organizational analytics package that companies usually need some consulting support to plan and deploy and then make sense of the data.
Two Analytics in Office 365
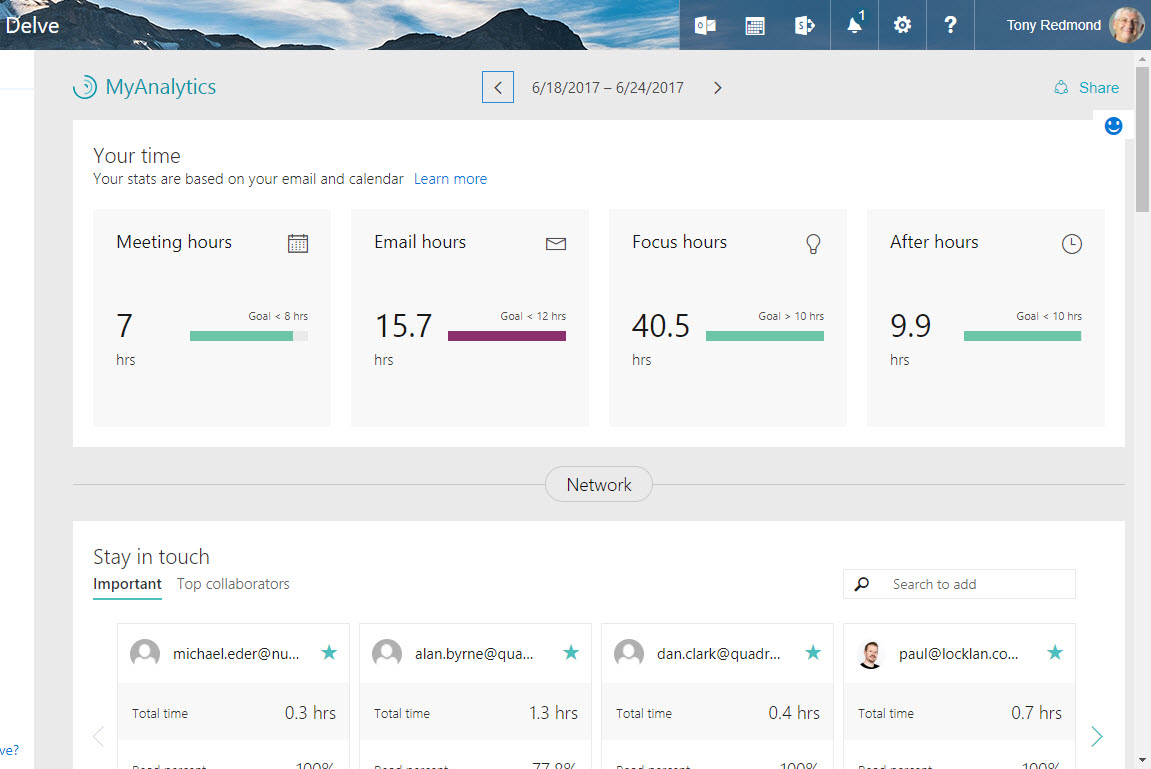
Office 365 boasts two analytics applications. The first, launched initially as “Delve Analytics” and now called MyAnalytics, delivers a personal dashboard to help users understand how they spend their working life (Figure 1). The intention is that people reflect on how much time they spent processing email, in meetings, or outside normal working hours and readjust what they do to become more effective, in whatever way you define that term.

For some, being more effective means achieving a better work-life balance. For others, it means realizing just how much time corporate meetings soak from their schedule and then dropping some meetings or reducing the time assigned to others. And for people like me who are email junkies, it might mean a more sensible cadence to the working day with specific periods set aside to process new messages.
I like MyAnalytics a lot, especially now that the development team has refocused their efforts to deliver more personal insights through the MyAnalytics Outlook add-in. Where this add-on used to focus on reporting how quickly recipients read email, now it looks for potential issues like conflicting meetings or unanswered email and flags them to the user. Of course, it is entirely up to you whether you take any note of this advice.
MyAnalytics is available to anyone with an Office 365 E5 license or those who buy a monthly add-on. Not all organizations will welcome this kind of technology. But those who deploy and use it effectively can gain great benefit by taking simple steps like removing redundant meetings by forcing schedulers to consider whether they still need these gatherings. Or, even better, by reducing the default time assigned to meetings from 1 hour to 30 minutes.
Data Drives Analytics
You cannot analyze much without good data. Both MyAnalytics and Workplace Analytics draw from the same well of email and calendar data held inside Exchange Online mailboxes and recorded in the Microsoft Graph. To round things out, Azure Active Directory holds information about the organization structure and reporting relationships.
The interesting point is that most of the data is obvious and available to end users and programs alike. Messages have delivery dates and meetings have start and end times and attendees. You can count the number of messages you receive in a day and time how long you spend reading and answering email. You can track who sends you email and to whom you send email. You can tot up the countless hours of fun meetings and note who was in the conference room or Skype call. In short, there is nothing secret here.
Humans are innovative and resourceful, but counting email or figuring out how many hours we spend dealing with work at the weekend is boring. Computers are better at boring, repetitive tasks and especially good at analyzing data gathered from these tasks. MyAnalytics analyzes email and calendar data to understand the people who are important to you, how you communicate, and where your time goes. The output is what people see in their personal dashboard.
Understanding the Workplace
Workplace Analytics does not combine the collective personal dashboards within a tenant to tell management who is productive and who needs some help sorting out their overpacked calendar. Instead, you should consider Workplace Analytics as a tool to help understand how an organization functions.
For instance, among the examples of how organizations use Workplace Analytics included in Microsoft’s post are:
“…the behaviors of managers were pivotal in determining employee engagement and retention”
“…analyzed the metadata attached to employee calendar items to calculate the travel time associated with meetings.”
Anyone who has ever worked inside a large organization likely understands that how direct-line managers deal with employees directly affects how people work and whether they stay with the company. The same is true for travel time. If you force people to come into central offices to attend meetings, you expect a productivity hit when attendees are traveling to the meetings.
The critical item to understand is that Workplace Analytics generates a set of collaboration metrics that analysts can use to detect inefficiencies and problems within a company. Like anything dealing with people, this is an imperfect science, and context is all-important in understanding why people work the way that they do.
Workplace Analytics is only available to Office 365 enterprise tenants with over 5,000 seats. The cost is $6/user per month unless you have Office 365 E5 licenses, in which case the cost is $2/user per month. The price of Workplace Analytics is enough to pause for thought. In addition, before you deploy, consider that you probably need to do some up-front work such as working with HR to ensure employee privacy is respected, establishing the core population for analysis, setting the goals for the exercise, and so on.
Outside the U.S. or in multi-national companies where worker unions or councils are more common, it is probable that approval is necessary from these bodies before any analysis can go ahead. For these and other reasons, you will likely need help from outside consultants with expertise in similar exercises to help run the project and gain usable results.
Some Data Gaps
Another thing to consider is that MyAnalytics and Workplace Analytics both focus in on email and calendar data and do not look at other areas of activity within Office 365. Analysis includes time spent on Skype calls if it is in your calendar but not otherwise. But it ignores the time composing an article like this in Word, even if you store the document in OneDrive for Business or SharePoint. Chatting in Teams or Yammer is also outside the current boundary for analysis.
A Good Start, but Lots More to Do
Microsoft is at the start of the analytics journey within Office 365. The Office Graph captures thousands of interactions for an active user monthly. The question is how to mine and analyze this data so that the output is valuable for individuals and the business. MyAnalytics is a good start for personal analysis. We will have to wait to see how Office 365 tenants embrace Workplace Analytics.
Follow Tony on Twitter @12Knocksinna.
Want to know more about how to manage Office 365? Find what you need to know in “Office 365 for IT Pros”, the most comprehensive eBook covering all aspects of Office 365. Available in PDF and EPUB formats (suitable for iBooks) or for Amazon Kindle.


