Copilot ROI: A 90‑Day Playbook That Measures Real Outcomes (Not Prompt Counts)
A practical framework for measuring Copilot’s real business impact.

There’s a growing disconnect between how organizations talk about Microsoft Copilot and how they measure it. Executives want productivity outcomes. IT wants operational clarity. Users want help with daily tasks. But somewhere along the way, too many businesses fall into the trap of using “usage” as a proxy for “value.”
The truth is simple: Using Copilot doesn’t mean Copilot is helping.
If you want credible return on investment (ROI)? Something you can defend to a CFO or CISO. Then you need a framework that measures impact, not experimentation. That’s what this 90‑day playbook delivers: how to quantify time saved, accuracy gained, workflows simplified, and governance strengthened using Microsoft 365 telemetry, Viva Insights, and secure operational baselines.
Stop measuring prompts. Start measuring outcomes.
Microsoft Copilot is not a chat toy. It’s an operational assistant embedded across Outlook, Teams, Word, Excel, Loop, and Windows. If you want to know whether it’s working, you must track Copilot’s influence on:
- Email throughput
- Meeting time and content quality
- Content generation speed
- Workflow automation lift
- Decision‑making efficiency
Most organizations default to simpler numbers. “200 Copilot prompts this week!”, because those are easy to pull from the admin center. Unfortunately, they tell you nothing. Usage volume is engagement, not effectiveness.
What matters is the delta between “before Copilot” and “after Copilot.”
The 4 metrics that actually prove ROI
Below are the metrics I consider credible indicators of Copilot value. All of them are measurable using Microsoft 365 data your tenant already collects.
1. Email time saved (Outlook + Viva Insights)
Copilot should reduce the time users spend triaging, drafting, and processing email. Viva Insights provides both baseline and ongoing email load statistics.
Measure:
- Average daily email time before deployment
- Average daily email time 30 and 60 days after rollout
- Copilot‑generated drafts vs. manual drafts
- Reduction in long‑form replies
You’ll find Copilot usage analytics in the Microsoft 365 Admin Center, not in Viva Insights. Microsoft splits the data intentionally: Viva Insights handles behavioral analytics, while Copilot usage lives in the admin layer.
| Metric | Can Viva Insights show it? | Where to get it |
|---|---|---|
| Average daily email time (baseline) | ✔️ Yes | Viva Insights |
| Email time 30/60 days post‑rollout | ✔️ Yes | Viva Insights |
| Copilot‑generated vs. manual drafts | ❌ No | Microsoft 365 Admin Center |
| Reduction in long‑form replies | ❌ No (not directly) | Proxy via Insights + Copilot usage |
You might have to be creative to measure a reduction in long-form email replies because it’s not directly measurable in Viva Insights or Copilot usage data. You could see if an increase in Copilot-generated email drafts correlates to a reduction in daily email time to give you a rough idea.
A 12–18% reduction in email load is feasible. Less than 5% means poor adoption or that users don’t trust AI‑drafted content yet.
2. Meeting recap accuracy and time recovered (Microsoft Teams)
If Copilot can summarize meetings accurately, users should attend fewer meetings. Or at least spend less time catching up on them.
Measure:
- Accuracy audits: randomly sample 10 recaps and score them on factual correctness
- Reduction in “mandatory attendance” meetings
- Time saved by replacing live attendance with recap reviews
- Percentage of meeting recaps shared across teams
Organizations that intentionally redesign meeting culture can reclaim hours per week per employee.
3. Workflow automation lift (Microsoft 365 + Power Automate)
Copilot should accelerate routine tasks and trigger new automation libraries.
Measure:
- Number of tasks transitioned from manual to automated
- Improvements in cycle time (e.g., monthly reports, incident write‑ups, compliance summaries)
- Document creation and editing time deltas
- Copilot‑assisted Excel transformations vs. manual formula creation
If automation lift is zero after 60 days, Copilot is being used as a chat bot and not an operational accelerator.
4. Governance and risk reduction (Entra ID + Purview)
Every Copilot deployment must demonstrate that AI does not increase exposure. Governance baselines for regulated tenants are part of actual ROI.
Measure:
- Reduction in overshared files after sensitivity labels are enforced
- Drop in risky app consent prompts
- Lower incidence of data leakage behaviors (copy, extract, forward)
- Improved alignment with industry frameworks (NIST, ISO, SOC2)
If Copilot improves compliance discipline and reduces accidental exposure, that’s measurable bottom‑line value.
A 90‑day Copilot ROI playbook
These dashboards reframe your rollout as three clear, measurable phases. Each phase includes Inputs, Outputs, and Signals of success; each giving executives a crisp view of Copilot’s impact.
🚦 30‑day dashboard: Baseline and readiness
Purpose: Establish reality. Secure the environment. Train the right people.
| Inputs | Outputs | Signals of success |
| Viva Insights baseline (email load, meeting load, focus time) Current sensitivity labeling & DLP posture Entra ID Conditional Access + identity governance configuration Pilot cohort (50–100 measurable users) Initial Copilot usage telemetry (not yet used for ROI) | Readiness Score: classification health, identity controls, device compliance Baseline Productivity Map: “before Copilot” metrics across email, meetings, document cycles Pilot Cohort Profile: roles, workloads, expected Copilot use patterns | You can clearly answer: “What does productivity look like today, before AI touches anything?” Governance gaps identified and prioritized Pilot group trained with task‑specific Copilot guidance |

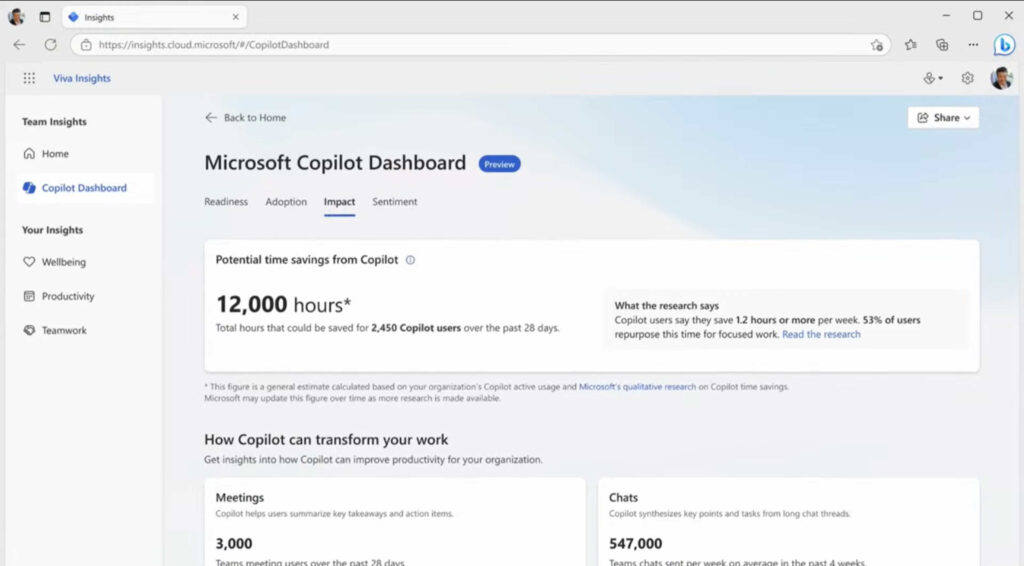
The Microsoft Copilot Dashboard can help you to assess your organization’s readiness.

📊 60‑day dashboard: Productivity signals and early impact
Purpose: Capture real improvements in daily work, not hypothetical benefits.
| Inputs | Outputs | Signals of success |
| Copilot‑generated email drafts vs. manual drafts Meeting recap accuracy audits (random sample scoring) Workflow usage patterns across Teams, Outlook, Excel, Word User‑submitted “workflow wins” with evidence (before/after time metrics) | Productivity Delta: Reduction in average email processing time Reduction in meeting attendance + recap reliance Faster document creation (draft > final cycle time) Recap Accuracy Score: quantitative rating from sampled meetings Emerging Automation Map: tasks repeatedly accelerated by Copilot that could become formal workflows | You can answer: “Is Copilot making a meaningful difference for real users?” Evidence of measurable time saved (not imagined or claimed) Recaps proven accurate enough to replace some meeting attendance Users demonstrating new behaviors, not just trying Copilot once or twice |

🧭 90‑day dashboard: Automation, governance, and ROI proof
Purpose: Convert wins into repeatable processes, measure compliance gains, and deliver a defensible ROI statement.
| Inputs | Outputs | Signs of success |
| Candidate workflows for automation (Power Automate + Copilot) Purview event data (sharing behavior, label adoption, DLP triggers) Entra ID sign‑in risk trends and OAuth consent patterns Team‑level usage patterns and department‑level productivity deltas | Automation Playbook: 3–5 repeatable workflows adopted by multiple users or teams Documented time savings per workflow Governance Strength Index: Reduction in oversharing Fewer risky app consent events Cleaner labeling + better isolation patterns ROI Report: A CFO/CIO‑ready summary showing productivity gains, risk reduction, and recommended scale‑up strategy. | You can answer: “Should we scale Copilot across the organization? And what value do we expect?” You have defensible numbers: time saved, accuracy impact, risk reduction, automation lift Governance is stronger with Copilot than without it (key audit finding) Automation is no longer user‑specific. It has become organizational |
Conclusion
AI isn’t magic, and Copilot isn’t a silver bullet. But with the right metrics, a structured measurement plan, and mature governance, Copilot can deliver real ROI. It becomes measurable, defensible, and scalable across the enterprise.
The key is to stop celebrating usage and start celebrating outcomes. Organizations that make this shift will turn Copilot into a competitive advantage. Those that don’t will end up with “AI‑powered” workflows that look impressive in screenshots but do nothing for the bottom line.
Russell Smith, the Editorial Director at Petri IT Knowledgebase, has over two decades of hands-on experience in IT, in both small business settings and government IT infrastructure projects. Russell started writing for Windows IT Pro Magazine in t...