What is Datadog – The Ultimate Guide

Datadog is a SaaS-based monitoring platform for cloud applications. In this guide, we’re going to detail how IT pros and DevOps teams can get started with Datadog and make the best use of this observability platform.
What is Datadog?
Datadog is a tool that allows you to monitor cloud infrastructure, Windows and Linux hosts, system processes, serverless functions, and cloud-based applications. It can be used to visualize data, explore metrics, manage logs, and perform various other tasks.
What are the main use cases for Datadog?
Datadog allows you to collect metrics and gather real-time in-depth insights about your IT infrastructure. Here are the main use cases for the app:
- IT pros can create, edit, and manage alerts and notifications about their IT infrastructure.
- Organizations can use Application Performance Monitoring (APM) to reduce latency and eliminate errors
- They can test production environments and performance.
- They can set up multiple integrations that gather metrics, traces, and logs to send data to the platform.
- They can use it as a security platform to detect threats and misconfiguration of applications in their infrastructure.
- If you use Jenkins, which is an automation server for deploying software, the app can help to visualize Jenkins job metrics and pipeline execution.
What technologies does Datadog support?
There are various technologies that Datadog supports such as Amazon Web Services (AWS), Azure, Google Cloud, Kubernetes, Red Hat OpenShift, and Pivotal Platform. Let’s quickly go through how these technologies integrate with Datadog:
- The app collects accurate system information, metrics, and tags from more than 70 AWS services.
- It supports more than 40 integrations with Microsoft Azure services.
- It collects all data from Google Cloud services through easy-to-install integrations.
- It also offers a way to monitor and perform health checks on Kubernetes clusters.
Datadog pricing
Before you start using Datadog, it is essential to understand the three different price plans:
- The Free plan gives up to one day of metric retention, and you can store events and metrics on up to 5 hosts without paying any money.
- The Pro plan provides more than 500 integrations, out-of-the-box dashboards with enhanced features, and 15-months of metric retention for 15$ per host/month.
- In the Enterprise plan, you will get premium technical support over chat, email, and phone. You also get 15 months of data retention and unlimited alerts, but the plan costs 23$ per host per month.
The app also offers 14-day free trials for its Pro and Enterprise plans, no credit card required.
How to set up the Datadog agent?
The lightweight Datadog agent needs to be installed on multiple servers to manage your infrastructure’s logs and events. Before you get started installing the Datadog agent, you’ll need the following things:
- A Datadog account
- To follow along, be sure you have an Ubuntu machine. This tutorial uses Ubuntu 21.04 LTS.
Installing and configuring the Datadog agent
The Datadog agent can be installed on various platforms including macOS, Windows, Debian, Ubuntu, Kubernetes, Openshift, etc. However, this tutorial will show you how to set up the agent on an Ubuntu machine.
- First, run the command below to update your system packages with the latest versions.
sudo apt-get update
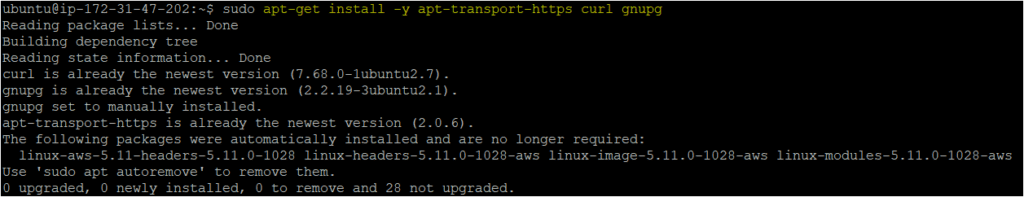
- Next, run the apt-get command to download the apt transport package which will allow your Linux machine to securely connect to repositories over HTTPS. GnuPG also encrypts and signs your data and communications.
sudo apt-get install apt-transport-https curl gnupg
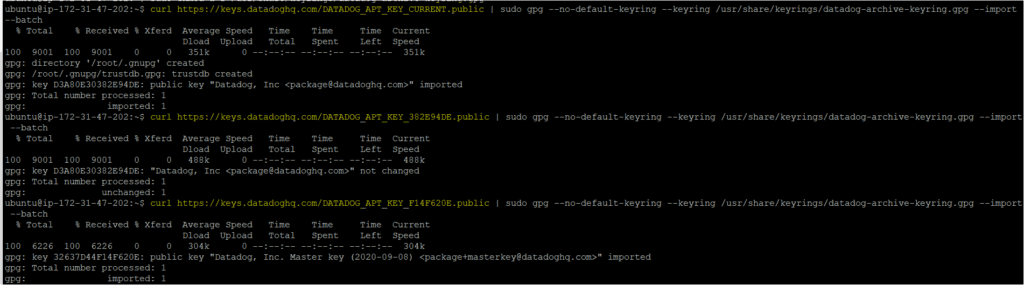
- Next, set up the Datadog repository on your Ubuntu machine and create a Datadog archive keyring by running the commands below. The Debian machine will digitally sign all its software files using the archive keys.
sudo sh -c "echo 'deb [signed-by=/usr/share/keyrings/datadog-archive-keyring.gpg] https://apt.datadoghq.com/ stable 7' > /etc/apt/sources.list.d/datadog.list"

sudo touch /usr/share/keyrings/datadog-archive-keyring.gpg
sudo chmod a+r /usr/share/keyrings/datadog-archive-keyring.gpg

curl https://keys.datadoghq.com/DATADOG_APT_KEY_CURRENT.public | sudo gpg --no-default-keyring --keyring /usr/share/keyrings/datadog-archive-keyring.gpg --import --batch

curl https://keys.datadoghq.com/DATADOG_APT_KEY_382E94DE.public | sudo gpg --no-default-keyring --keyring /usr/share/keyrings/datadog-archive-keyring.gpg --import –batch

curl https://keys.datadoghq.com/DATADOG_APT_KEY_F14F620E.public | sudo gpg --no-default-keyring --keyring /usr/share/keyrings/datadog-archive-keyring.gpg --import --batch
- Now, create and set up the Datadog archive keyring using the command below. Also, add permissions to the keyring where “r” means recursively changing the permission of the directory and content, and the “a” flag means applying the authorization to the user and owner.
sudo touch /usr/share/keyrings/datadog-archive-keyring.gpg
sudo chmod a+r /usr/share/keyrings/datadog-archive-keyring.gpg
- Again, run the apt-get update command to update your local apt repository.
sudo apt-get update
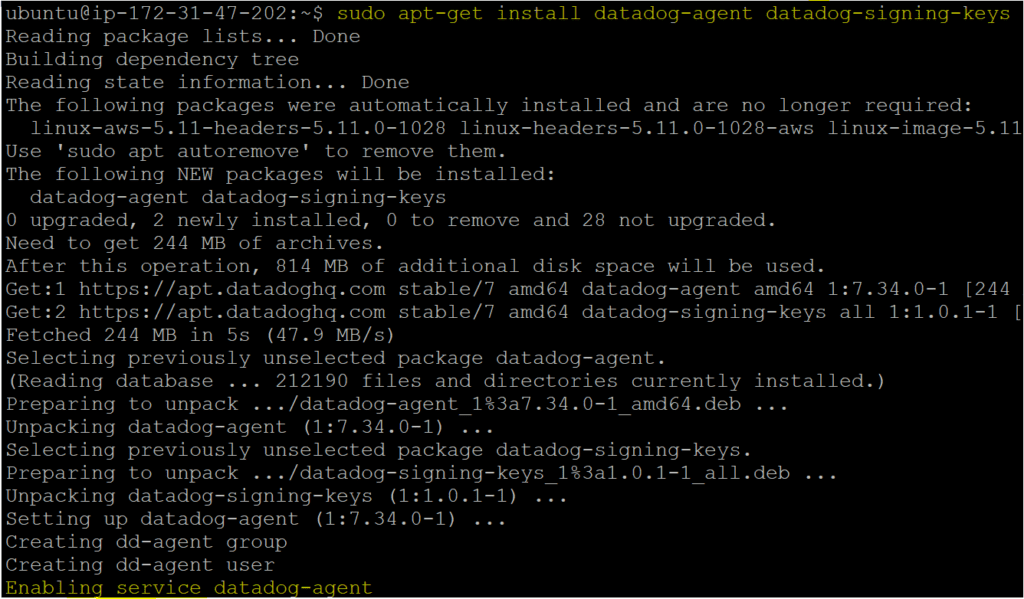
- Next, install the Datadog agent by running the following commands.
sudo apt-get install datadog-agent datadog-signing-keys
- Now, configure the Datadog configuration file (datadog.yaml) before starting the agent in the next step. Here, the API keys will need to be replaced with your Datadog account’s API key.
Callout: The API keys are generated as soon as you register your account in Datadog and API keys are different for all users. You can find your API key in Datadog under Integrations > APIs.
sudo sh -c "sed 's/api_key:.*/api_key: <API-KEY>/' /etc/datadog-agent/datadog.yaml.example > /etc/datadog-agent/datadog.yaml"
sudo sh -c "sed -i 's/# site:.*/site: datadoghq.com/' /etc/datadog-agent/datadog.yaml"
sudo sh -c "chown dd-agent:dd-agent /etc/datadog-agent/datadog.yaml && chmod 640 /etc/datadog-agent/datadog.yaml"
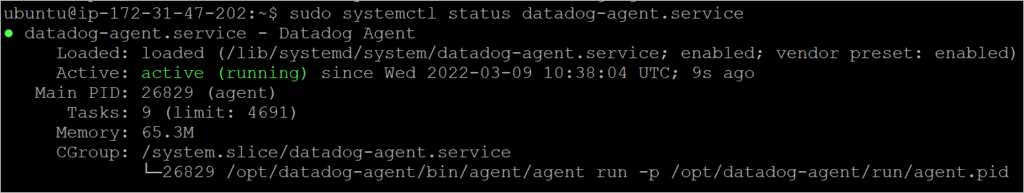
- Finally, start the Datadog agent using the command below.
sudo systemctl start datadog-agent.service
What is Datadog ’s Autodiscovery feature?
One of the best features of Datadog is Autodiscovery, which allows it to automatically identify various components in an environment or system such as services or containers.
To set up Autodiscovery, you need to edit the Datadog agent configuration file and restart the Datadog agent. For example, to monitor Docker container information such as start time, etc., you can add the text below to the configuration file.
Callout: Docker applications run inside lightweight environments known as containers that run Docker images.
| listeners: – name: docker config_providers: – name: docker polling: true |
How to set up or configure agent integrations with other services
Datadog provides more than 500 integrations with other apps and services. Integrations allow you to work with various tools such as Active Directory, AWS EC2, AWS Elastic Kubernetes Services (EKS), and Ansible to fetch application metrics and logs from an extended infrastructure.
Configuring agent integrations
The app provides three main types of integration:
- Agent-based
- Authentication-based
- Library-based
Now, let’s quickly learn how to activate or configure an agent integration by performing the following steps below.
- In the agent root directory folder (conf.d), rename conf.yaml.example. to conf.yaml. Then, you can edit the file according to your requirements, such as for fetching Apache logs. You can edit the file as shown below.
| init_config: service: apacheinstances: – apache_status_url: http://localhost/server-status?autologs: – type: file path: /var/log/apache2/access.log source: apache |
- Finally, restart the Datadog agent so that the changes you made in the configuration file are applied and the app can start ingesting the logs.
How to get started with the Datadog service
After setting up the Datadog agent and integrations, you’re now ready to use the platform’s various capabilities. We’ll guide you through some of the first tasks you can carry out.
Monitoring your infrastructure
It is crucial to monitor your cloud or data center infrastructure, which may contain hundreds of applications. If one of them stops working, other impacted applications may affect your business.
To monitor your infrastructure, you’ll need to have metric monitors in place. The Manage Monitors page is where you can manage all alerts, and the Triggered Monitors page allows you to trigger alerts and control downtime.
You can create various statuses in your infrastructures such as “OK”, “Warning”, and “No data”, and prioritize monitoring based on statuses like Critical, High, Medium, Low, and Info.
There are many things that you can monitor in your infrastructure such as events, processes, hosts, integrations, etc. Now, let’s quickly learn how you can monitor your infrastructure.
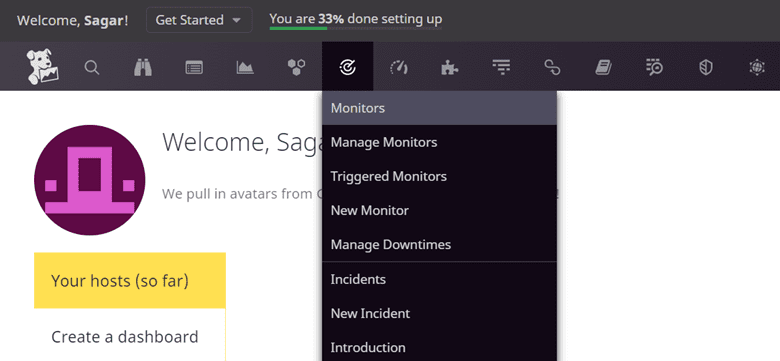
- First, navigate to the Welcome page and then go to the Monitor tab. There, you will notice several options in the dropdown menu including Manage Monitors, Triggered Monitors, New Monitor, and Manage Downtimes.
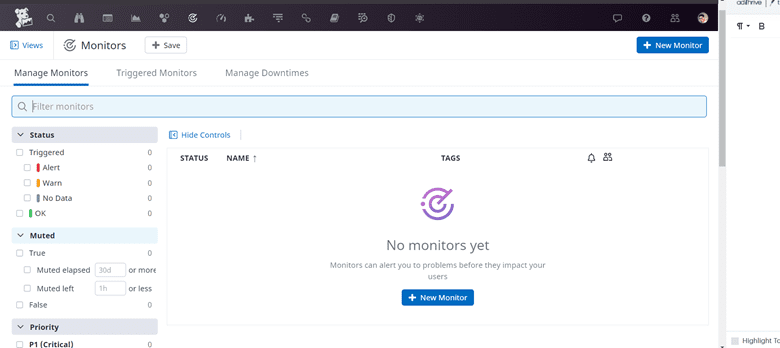
- As you can see below, after visiting the Manage Monitors page, there are zero warnings and alerts in the status menu.
Log management
Datadog can collect logs from various sources such as servers, AWS EC2 instances, containers, and other cloud-based environments. Logging allows you to collect, process, and monitor various logs across the system.
Let’s quickly see how we can configure sources that fetch and forward logs from multiple sources to the app. To do that, we’ll need to edit the configuration file (conf.yml) stored inside our Datadog agent installation directory.
Below is an example of a configuration file that stores your machine’s HTTP web server logs and forwards them to Datadog.
| logs:- type: file
path: /path/to/your/integration/access.log source: integration_name service: integration_name sourcecategory: http_web_access |
Creating customizable dashboards
One of the best features of Datadog is its ability to create customizable dashboards for tracking, analyzing, and displaying various performance metrics. Dashboards allow you to monitor and visualize the health of your environment and infrastructure at a glance.
Dashboards can also be easily viewed on mobile devices by downloading the Datadog mobile app from the Apple App Store or Google Play Store.
You can create a new dashboard by following these steps:
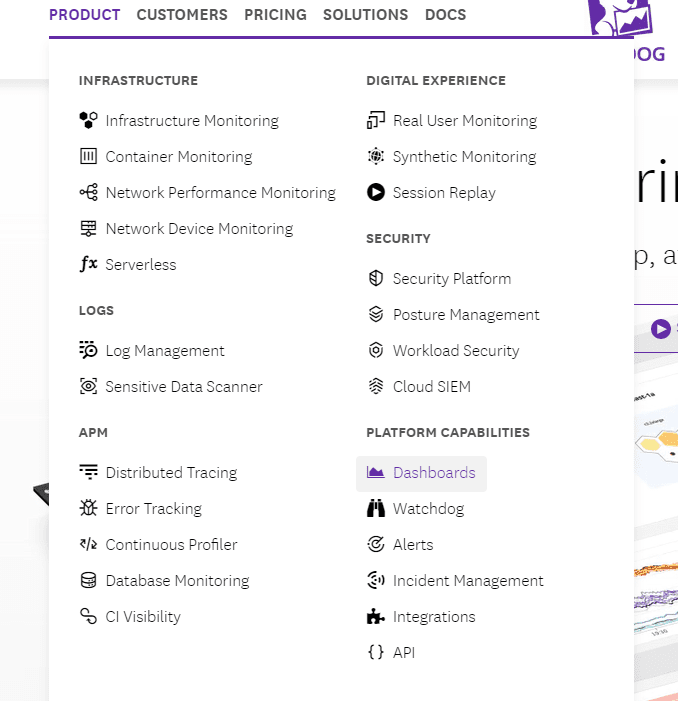
- First, navigate to the Datadog website.
- Click on the PRODUCT tab and select Dashboards, as shown below.
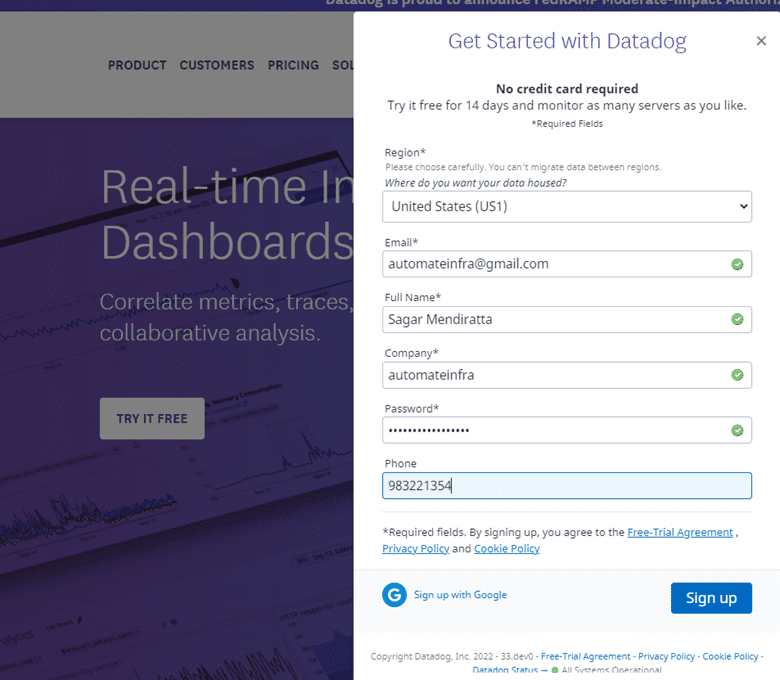
- Once you click on Dashboards, it will take you to a new page where you will see a “TRY IT FREE” button. Click on the button and sign up for Datadog, as shown in the image below.
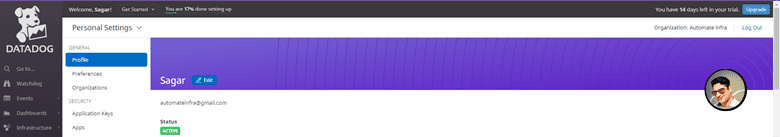
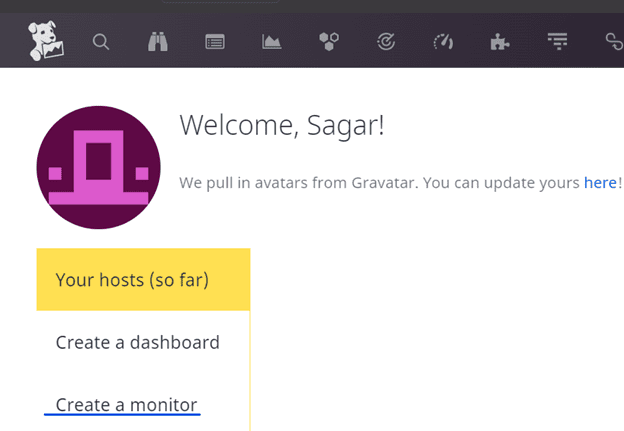
- After you sign up with the form, you will see the welcome page displayed below.
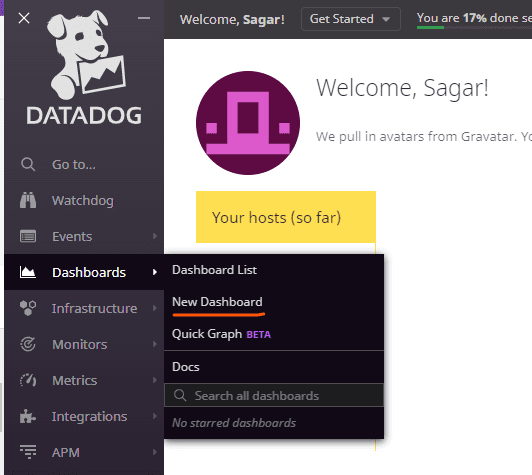
- To create a new dashboard, click on the Dashboard option on the left sidebar, then click on New Dashboard as demonstrated below.
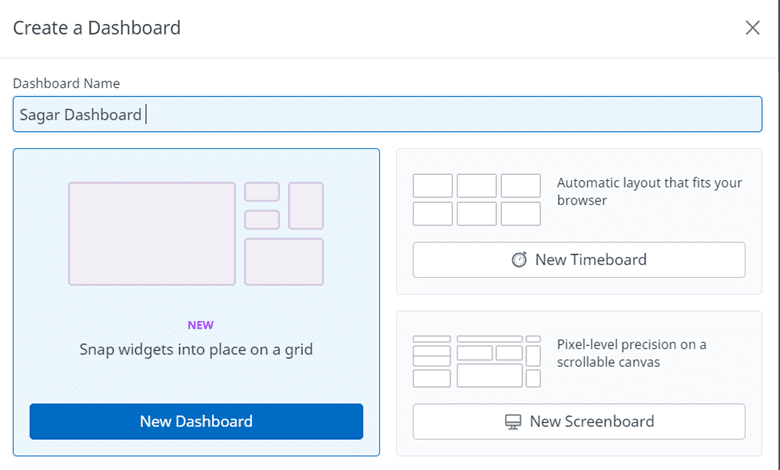
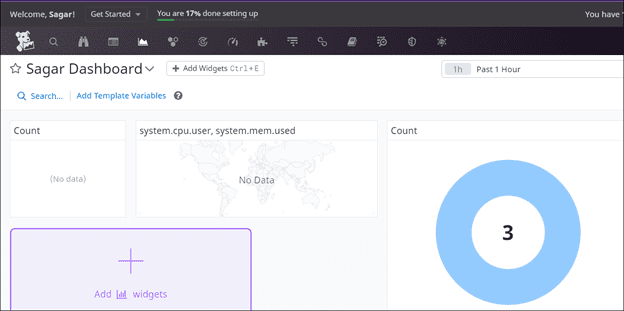
- A new window screen will open, which will allow you to create a dashboard and specify its name.
- You will have the option to set widgets for your new dashboard by adding items in the dashboard tray, including various graph types (Timeseries, Query value, Top list, Table, Heatmap, Distribution, Event timeline, Treemap, Pie Chart, Funnel).
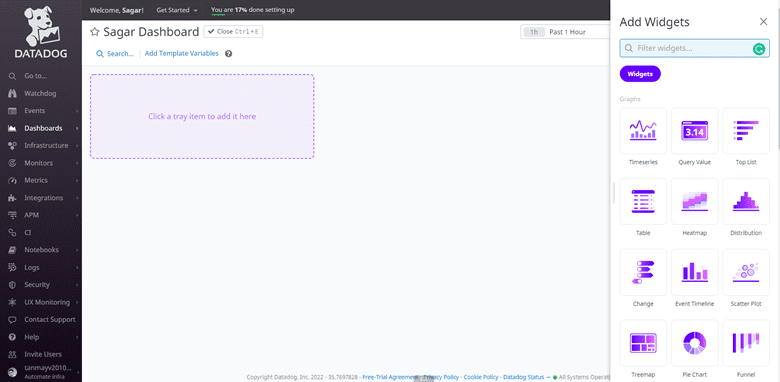
- Now, the dashboard is appropriately configured for tracking and performing queries, database queries, and troubleshooting cloud services.
Creating monitors to get alerts and notifications on metrics
It is essential to understand how to make monitors receive alerts and notifications for various performance metrics. You can follow these steps to create a monitor.
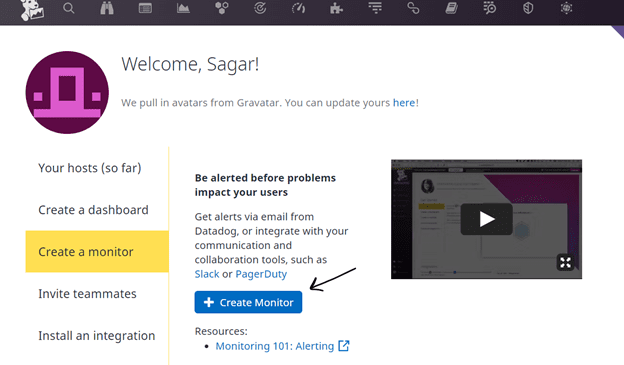
- On the Datadog Welcome page on the top left side, click on the Datadog logo icon, look for the Create a monitor option and click on it.
- Now you will see another Create Monitor button and you’ll need to click on it. It will allow you to create a monitor of your choice.
Conclusion
Datadog is a free tool with a whole lot of features. With this guide, you should now understand what’s possible to do with Datadog, from managing configurations to monitoring and tracking metrics.
You also learned how to set up the Datadog agent on Ubuntu, although you can set it up on various operating systems. Now that you have a good idea about everything this app can do, what do you plan to monitor with it?

Sagar is a DevOps consultant and the founder of automateinfra.com. Sagar brings DevOps technology expertise to Petri.com, writing about Terraform, AWS Cloud, Microsoft Azure, Ansible, Kubernetes, Docker, Jenkins, Linux, and Windows.