Free Tools for Troubleshooting Windows Storage Performance Problems
Introduction
This article covers free Windows troubleshooting tools for identifying storage performance issues, some of the toughest performance problems to diagnose. In many cases, a system administrator must be intricately familiar with the underlying storage architecture to effectively troubleshoot storage slowdowns. Fortunately, there are a variety of free tools that can be used to monitor storage performance metrics to help determine what is causing your storage woes.
Task Manager
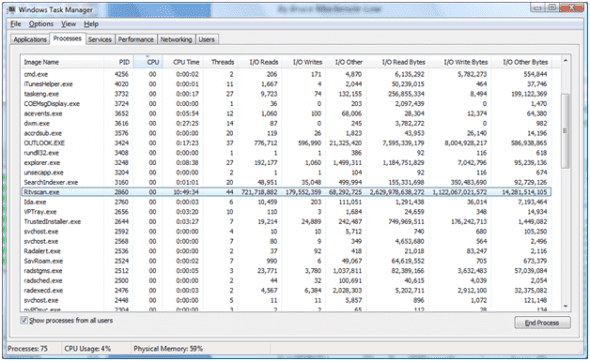
To get a cursory view of the problem, use the Task Manager (Ctrl+Shift+Esc) to select the Processes tab. Use the View pull-down menu to Select Columns… specifying I/O Reads, I/O Writes, I/O Other, I/O Read Bytes, I/O Write Bytes, and I/O Other Bytes. These I/O metrics will identify if a particular process is responsible for causing the I/O bottleneck. Keep in mind that the I/O metrics include both disk and network I/O operations. As you can see below, the Rtvscan.exe process (real time virus scan) is consuming significantly large amounts of I/O. While this is typical for a virus scanner to consume large amounts of I/O, they are often blamed for storage performance slowdowns.
Perfmon
If you need to shed some more light on your storage performance problems, it may be necessary to gather some performance metrics in a log file. This will allow you to collect the data while the problem is occurring, and then analyze the data with charts and graphs to identify any problem areas. Windows provides a built-in system tool known as the Performance Monitor, Perfmon for short. Perfmon allows you to graph various performance counters illustrating the minimum, maximum and average values across a time range. There is also a handy utility called PerfWiz from Microsoft that provides a menu-driver interface to automate the collection of Perfmon data.
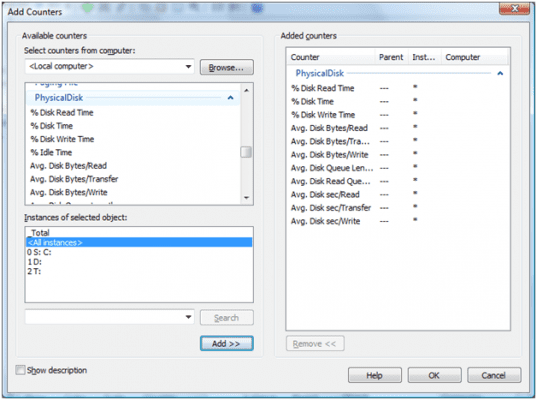
The performance metrics are divided into various objects, counters and instances. For example, the Perfmon objects that would be used to troubleshoot a storage performance issue would include the LogicalDisk and PhysicalDisk objects. Within these objects, you would specify all the various disk-related counters such as % Disk Read Time, Avg. Disk Bytes/Read, etc…, and for each counter specify all the instances (i.e. all the disk drives). You can see below how Perfmon is used to specify the PhysicalDisk object and all the various disk-related counters for all instances.
Once the performance metrics are collected in a binary log file (BLG), the data can be read into Perfmon and then used to generate graphs. By graphing a particular counter, for example Avg. Disk Bytes/Read, for all instances (disks), you can typically determine which disk drive is causing the perceived slowdown. Keep in mind, there are numerous counters which must be reviewed to determine if there are multiple I/O bottlenecks, or correlations between counters (e.g. high read-rate on disk D:, high write-rate on E:).
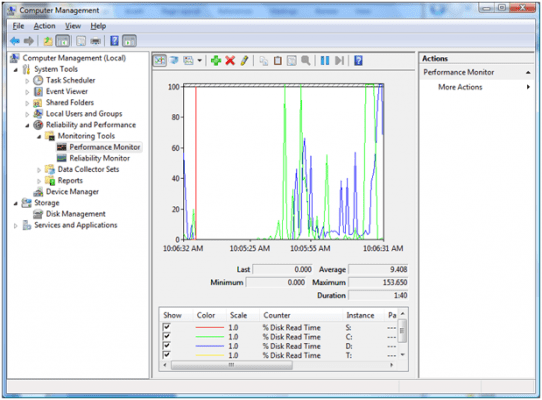
In the following example, you can see how Perfmon is accessed from the Computer Management MMC. The green “+” toolbar icon is used to add counters to the graph while the red “x” is used to remove counters. The first 2 toolbar icons are used to view current activity or from a log file. There is extensive online Help to assist you with creating a Perfmon log file and creating graphs with the various counters. Looking at the graph below, you can see how disk D: (blue line) began experiencing a high % Disk Read Time at 10:05:55AM and continued to increase. This was simulated with a virus scan of disk D:.
Summary
As you can see, right out of the box there are tools such as Task Manager and Perfmon that you can use to troubleshoot storage related performance problems. These tools gather and display the performance metrics to help identify any I/O bottlenecks or saturation. In addition to the Windows troubleshooting tools mentioned here, stay tuned for future articles on other free tools such as Performance Analysis of Logs (PAL) and xPerf to analyze storage performance data.


