- Blog
- SQL Server
- Post
What is SQL Server Reporting Services?
SSRS is one of the core Business Intelligence (BI) components in today’s SQL Server release.

SQL Server Reporting Services (SSRS) is a set of on-premises tools and services that enable you to create, deploy, and manage printed, web, email and mobile reports from SQL Server databases. Let’s look at its evolution and capabilities in more detail.
When SQL Server was first released it was a simple relational database but as time has gone on Microsoft has added a number of subsystems that have marked the evolution of SQL Server into an enterprise data platform. One of these systems is Microsoft SQL Server Reporting Services (SSRS).
Along with SQL Server Analysis Services (SSAS) and SQL Server Integration Services (SSIS), SSRS is one of the core Business Intelligence (BI) components in today’s SQL Server release. SSRS is a set of on-premises tools and services that enable you to create, deploy, and manage printed, web, email and mobile reports.
Reports can retrieve data from SQL Server databases and Analysis Services as well as other relational database such as Oracle, MySQL, and Azure SQL Database. SRS eliminates the need to produce reports using other external tools like Crystal Reports or Excel workbooks.
A web portal allows you to organize and display Reporting Services reports and Key Performance Indicators (KPIs). Reports can also be incorporated into web and Windows-based applications as well as viewed in SharePoint, Power BI dashboards, and mobile devices like Android and iOS. SSRS reports can be paginated. They can support drill-through and sub-reports.
SQL Server editions with SSRS
Microsoft first released SSRS as an add-on to SQL Server 2000 in 2004 and it was incorporated into the main release with SQL Server 2005. It is currently a part of the most recent SQL Server release. SSRS is included as an installation option for all of the major editions of SQL Server:
- Enterprise edition
- Standard edition
- Web edition
- Developer edition
- and Evaluation edition.
In addition, a version of SSRS limited to 4GB of RAM is available with the free SQL Server Express with Advanced Services edition.
SSRS components
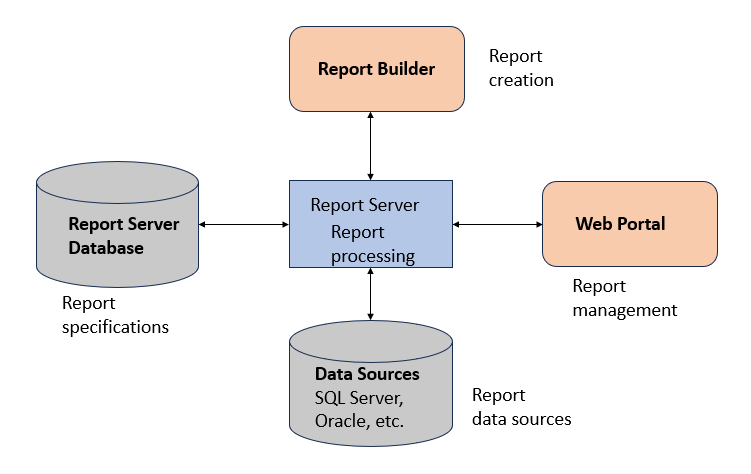
The SSRS subsystem consist of multiple components. The core components for SSRS are:
- Report Server – The SSRS Server is the main report processing engine. In simple installations it typically runs on the same system as the SQL Server relational database engine. In more complex setups it can run on a dedicated system.
- Report Server Database – Stores report definitions as well as security and management information.
- Report Builder – Provides a standalone graphical report design environment.
- Web Portal – Provides a web-based interface that’s used to manage reports, security, subscriptions, and data sources. The web portal can be accessed using a web browser. You can use Edge, Safari, Firefox, and Chrome.
You can see an overview of the SSRS system architecture in the following figure.
SSRS Reporting Tools
There are three primary tools that can be used to create SSRS reports:
- Report Builder – A standalone tool for authoring, managing, and publishing reports for SSRS. Report Builder can be downloaded from the web portal or from the Microsoft Download Center.
- Report Designer – Provided as a part of Visual Studio (including the free Visual Studio Community edition) as a part of the SQL Server Data Tools (SSDT) add-on.
- SQL Server Mobile Reports — Enables you to create mobile reports that dynamically adjust the content to fit your screen or browser window. SQL Server Mobile Reports are designed using Visual Studio and SSDT.
Previous releases of SQL Server provided the SQL Server Mobile Report Publisher. However, it has been deprecated for all releases of SSRS after SQL Server Reporting Services 2019 and it has been completely discontinued in SQL Server Reporting Services 2022.
SSRS report formats
SSRS reports are designed using Report Definition Language (RDL). RDL contains instructions for rendering the design of the report at run time. RDL describes all possible elements of a report using an XML grammar that’s validated by an XML schema. RDL is essentially the output of Report Builder and Report Designer.
The actual reports can be rendered in a number of different formats. The SSRS rendering extensions include:
- HTML
- Excel
- Word
- PowerPoint
- CSV or Text
- XML
- Image
- Data Feed
- and PDF.
In addition, you can create your own custom rendering extensions.
Summary
In this article you learned about how SSRS is architected and how it can be used to create reports using data from SQL Server, Analysis Services or other relational data sources.
SSRS is included as an installation option for SQL Server. Plus, it can also be downloaded from the Microsoft Download Center. With the exception of the limited version included with SQL Server Express with Advanced Services, SSRS is not a free product. You must have a SQL Server license in order to use it.

Michael Otey is president of TECA, a technical content production, consulting and software development company in Portland, Ore. Michael is a former SQL Server MVP and was Senior Technical Director for Windows IT Pro and SQL Server Pro. He covers the...