Microsoft Network Monitor – Part 2
- Blog
- Networking
- Post
In Part 1 of this post, we talked about:
- where to take a capture
- how to gather documentation and use a cheat sheet
- how to customize what information should be captured
- how to customize the user interface
Here in Part 2, we’ll talk about:
- how to make sense of the captured data
- how to get more information out of the data that’s captured
- how to view specific frames in an XML format and in a window by themselves
Ready? Let’s get started.
(Instructional video below provides a walkthrough of the steps contained in this article.)
How to make sense of the captured data
Using aliases
When you start dealing with multiple machines and big traces, that Frame Summary window can be very confusing to look at. It would help you work more efficiently if you could quickly identify the machines involved in a particular process.
For example, it would help if you could quickly determine which machine served as the source machine, i.e. where the command originated from, and which machine served as the destination machine, i.e. where the command was ultimately processed.
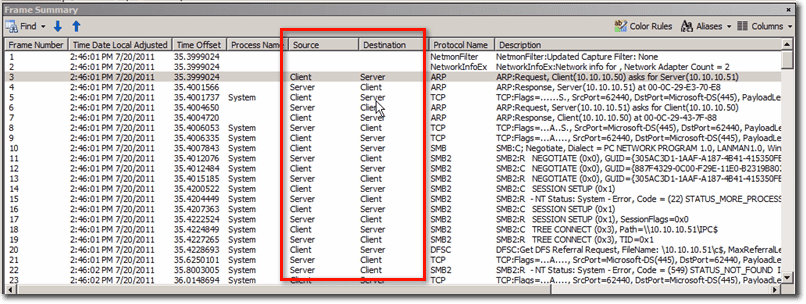
One solution is to use aliases. Aliases allow you to turn IP addresses into names that make sense in a particular network capture. For example, you could label one machine as ‘Server’ and another machine as ‘Client’.
In Network Monitor, you can even create an alias list containing all the aliases of all your servers (e.g. Domain Controllers, Exchange Servers, SQL Servers, etc), which you can then use in multiple traces in the future.
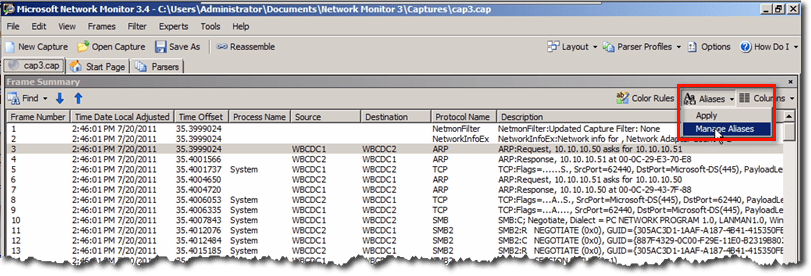
To create an alias, click the Aliases menu and select Manage Aliases.
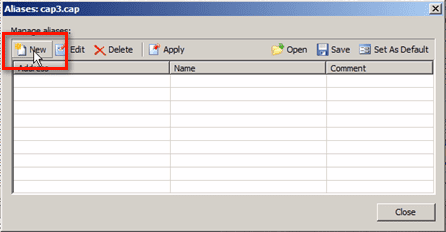
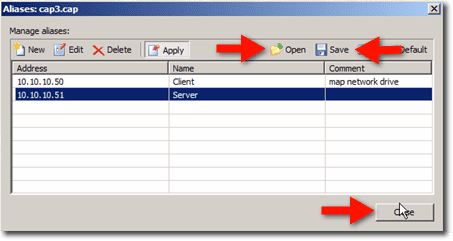
In the Manage aliases window, click New.
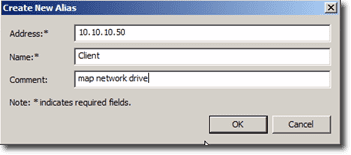
Enter the IP address of the machine whom you’d like to assign an alias to. Give it an alias Name. For example, for a machine that initiated a conversation, you can label that Client. Type in a suitable comment. If we use the example in Part 1 of this post, a suitable comment would be “map network drive”. Click OK.
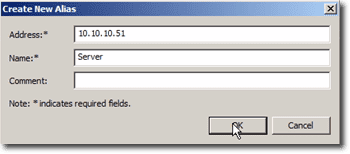
Here’s another sample alias. Here, we created an alias for the server in this particular conversation. Click OK.
You can then click Close if you just intend to use these aliases for one session. Or, alternatively, you could save that list by clicking the Save button. That way, you can load that list in future sessions and apply it to a capture by clicking Open and selecting the list in question.
After closing that window, you’ll then see the newly assigned aliases in the Frame Summary pane (assuming of course the machines in question are there).
Note: When you Open an alias list, you need to click the Apply button under the Aliases menu in order for that list to apply to the capture.
Using PING packets as bookmarks
Another nifty trick you can employ when dealing with really large traces is to use PING packets as bookmarks.
Here’s a sample scenario where you’ll find this particular technique useful. Let’s say you have an Exchange Server and hundreds of Outlook Clients. If one particular Outlook Client is having a problem and is not able to retrieve email from the Exchange Server, how can you quickly focus, in a capture, the interaction between that specific client and the server?
In a typical network environment, you’ll find a cacophony of packets as different machines communicate with one another. Here’s a simplified depiction of such an environment.
PACKET PACKET PACKET PACKET PACKET PACKET PACKET PACKET PACKET PACKET PACKET PACKET PACKET PACKET PACKET PACKET PACKET PACKET PACKET PACKET PACKET PACKET PACKET PACKET PACKET PACKET PACKET PACKET PACKET PACKET PACKET PACKET PACKET PACKET PACKET PACKET PACKET PACKET PACKET PACKET PACKET PACKET PACKET PACKET PACKET PACKET PACKET PACKET PACKET PACKET PACKET PACKET PACKET PACKET
To focus on a particular traffic coming from a particular client, you can use PING. In the sample scenario mentioned earlier, you can go to the Outlook Client, PING the Exchange Server, and then attempt to retrieve email from the server. Once that’s done and you get an error message on your screen, you then PING the server one more time.
The result would roughly look like this:
PACKET PACKET PACKET PACKET PACKET PACKET PACKET PACKET PACKET PACKET PACKET PACKET PACKET PACKET PACKET PACKET PACKET PACKET PACKET PING PACKET PACKET PACKET PACKET PACKET PACKET PACKET PACKET PACKET PACKET PACKET PACKET PACKET PACKET PACKET PACKET PACKET PACKET PACKET PACKET PACKET PACKET PING PACKET PACKET PACKET PACKET PACKET PACKET PACKET PACKET PACKET PACKET PACKET
With that, you can then focus on the packets found in between those two PING packets.
How to get more (or less) information out of the data that’s captured
If you look at the Frame Summary pane, you’ll see that there are lots of information in there. You can scroll to the right to see more. But those aren’t the only information that Network Manager is able to gather. You can actually add more information by adding more columns.
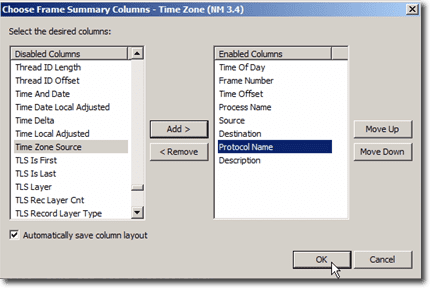
To do that, just go to the Columns menu and select Choose Columns.
What you’ll see are more or less hundreds of columns which can be added to the Frame Summary.
Just select a column name on the Disabled Columns list and click the Add button. Once a column has been transferred to the Enabled Columns list, you can position the newly added column with respect to the other columns by selecting it and clicking the Move Up or Move Down buttons.
After you’re done with all that, click OK.
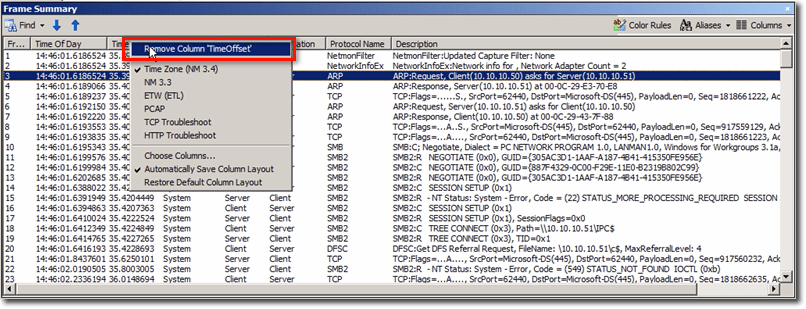
You’ll then see your newly added column inside the Frame Summary pane. Since you can add columns, you can of course also remove columns. To remove a column, right-click on a column’s heading and, in the context menu that appears, click Remove Column [name of column]. For example, to remove the Time Offset column, right-click on its heading and click Remove Column ‘Time Offset’.
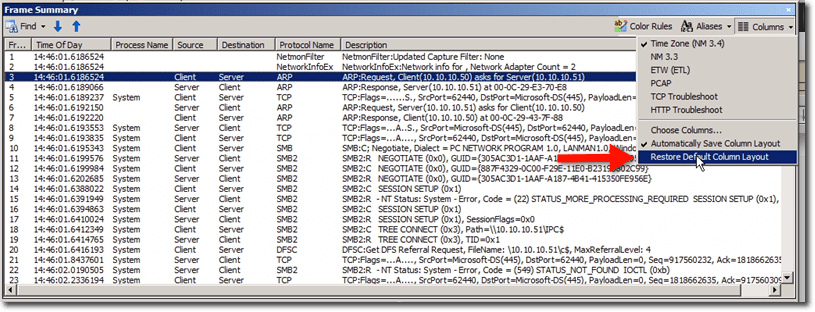
If, after adding, removing, and moving columns, you realize that you’re better off with the default column layout, just click the Columns menu and select Restore Default Column Layout.
Also, in case you want to retain your last column layout. That is, if you want your last column layout to be the same layout on your next Network Monitor session for that capture, make sure the Automatically Save Column Layout (see previous screenshot) is checked.
How to view specific frames in a window by themselves or in an XML format
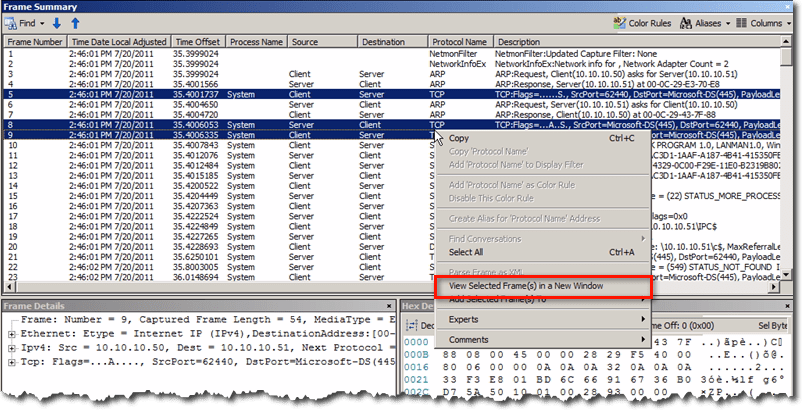
There will be times when you will like to focus on certain frames and concentrate only on the information related to them. You can actually display those frames on a new window by themselves. In the Frame Summary, select the frames you want to focus on, right-click on any of ones you selected, and click View Selected Frame(s) in a New Window.
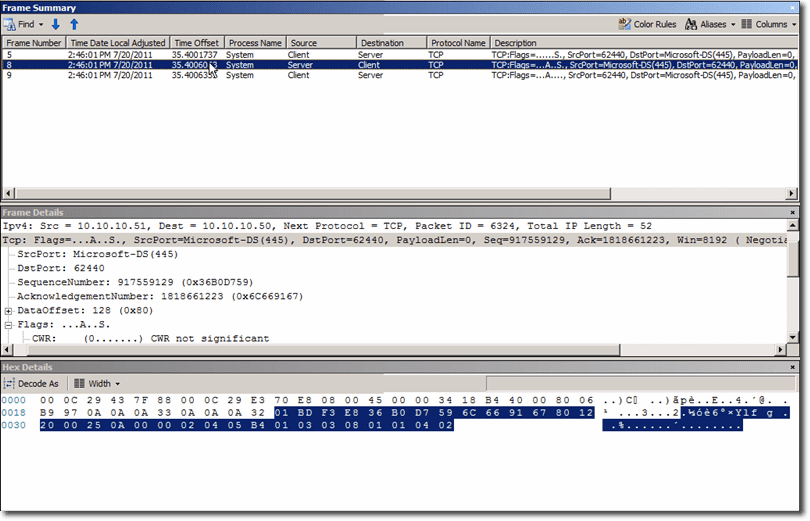
This will then open a separate window containing only those frames you selected. If you click on an individual frame, you’ll see, in the accompanying panes, information related to that particular frame.
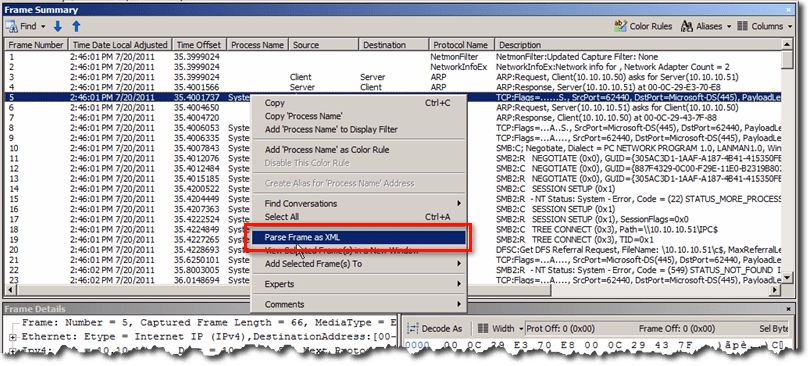
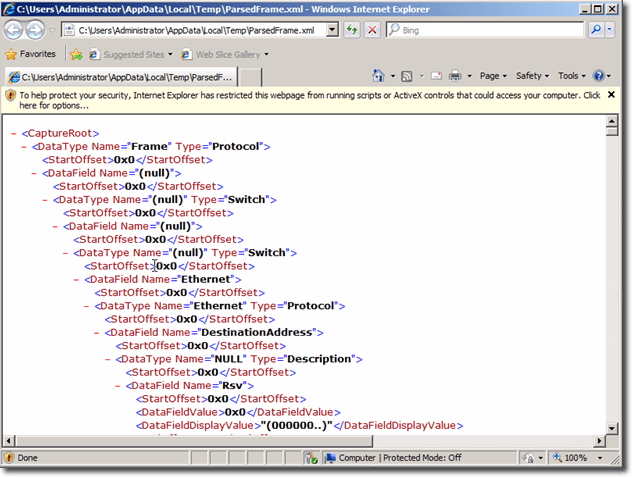
Alternatively, you can parse them in an XML file so you can import the information into a different application for whatever your needs might be. To do that, just right-click again on the selected frame or frames and then select Parse Frame as XML.
This is how the data packet would then look like.
Conclusion
Microsoft Network Monitor is a very useful tool that allows Network Admins to keep track of what is being sent across the network on the lowest level. The tool provides functionality to explore what packets are being sent across the network and where they are being sent from. The amount of data can be a little overwhelming but hopefully Part 2 of Rhonda Layfield’s two-part series has provided some insight to get the most out of Microsoft Network Monitor and work your way through the data that the tool captures. Hope you found it helpful!


