Microsoft Network Monitor – Part 1
- Blog
- Networking
- Post
Microsoft offers a network diagnostic/monitoring tool that allows you to perform network trouble-shooting tasks. Aptly named Microsoft Network Monitor, this tool collects information from a network’s data stream and displays different types of information, including:
- the source address of the computer that sent a frame onto a network
- the destination address of the computer that received the frame
- the protocols used to send the frame
- the data, or portion of the message being sent
- and many others
(Instructional video below provides a walkthrough of the steps contained in this article.)
Capturing
Microsoft Network Monitor collects information using a process known as capturing. You can use this tool to capture statistics on all frames it detects on the network or on a specific subset of frames. In this post, we’ll show you:
- where to take a capture,
- how to gather documentation and use a cheat sheet,
- how to customize what information should be captured,
- how to customize the user interface,
- how to make sense of the captured data,
- how to get more information out of the data that’s captured, and
- how to view specific frames in an XML format and in a window by themselves.
Where to take a capture
The decision on where you need to take a capture from will depend on certain conditions like say, the number of machines involved or whether firewalls are in place.
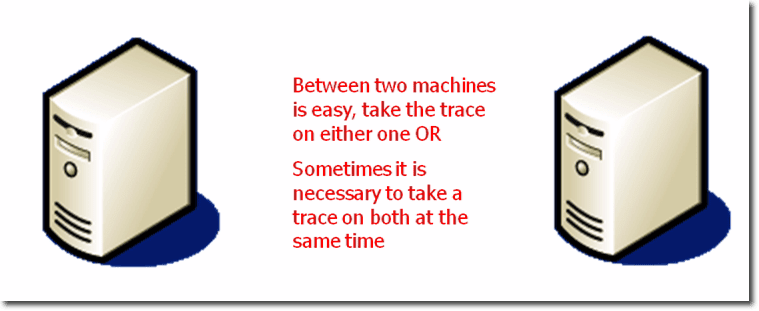
For example, if you have two machines, there can be two possible scenarios: 1) when there are no firewalls involved and 2) when there are.
In the first scenario, you can take a trace on either machine. However, in the second scenario, you might want to take a trace on both machines at the same time.
The first trace on the first machine is to determine whether there are any data packets that are being dropped due to existing outbound firewall rules. The trace on the second machine, on the other hand, is to determine whether there are any inbound firewall rules that are preventing data from coming in.
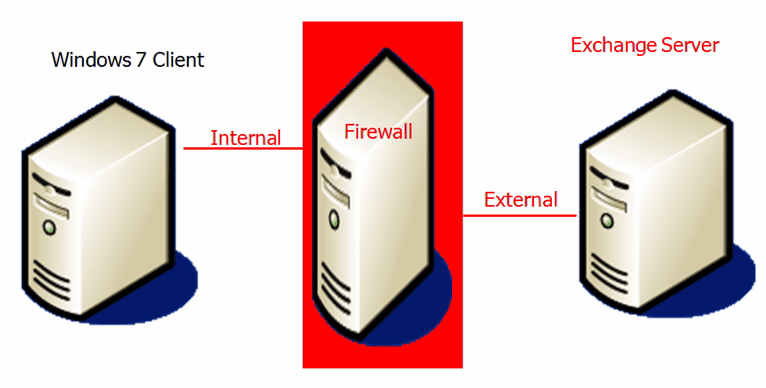
In a real world scenario like the one below, you can take traces on the following locations:
- On the Windows 7 Client’s network interface
- On the internal side of the firewall
- On the external side of the firewall, and
- On the inbound network adapter on the Exchange Server
The trace on the external side of the firewall should be there just in case the firewall has been configured with rules that drop packets which you are not aware of. With these four traces, you can tell whether the packets left the Windows Client, went through the firewall, and entered the Exchange Server.
How to gather documentation and use a cheat sheet
When your network starts to grow and you start having multiple machines (some probably spanning different time zones and continents), you will need to use a cheat sheet to record data regarding issues you encounter along the way.
Many of these issues take days or even weeks to resolve and often involve traces with hundreds of thousands packets in them. Oftentimes, you won’t be troubleshooting a single trace in just one troubleshooting session.
So if you don’t keep any documentation, chances are, you’ll forget the details of certain issues in a trace and when it’s time to resume troubleshooting on it, you will be forced to start all over again.
Some of the things you will want to record are:
- the issues themselves
- IP addresses of the machines between which the information you’re looking for is located
- packet numbers you’ve already analyzed or still have to analyze
Here’s an example where we show you how a typical cheat sheet is used.
Let’s assume we have two domain controllers. One domain controller, say DC1, has an IP address of 10.10.10.50. The other domain controller, say DC2, has an IP address of 10.10.10.51.
Let’s also assume that we just mapped a network drive on DC1.
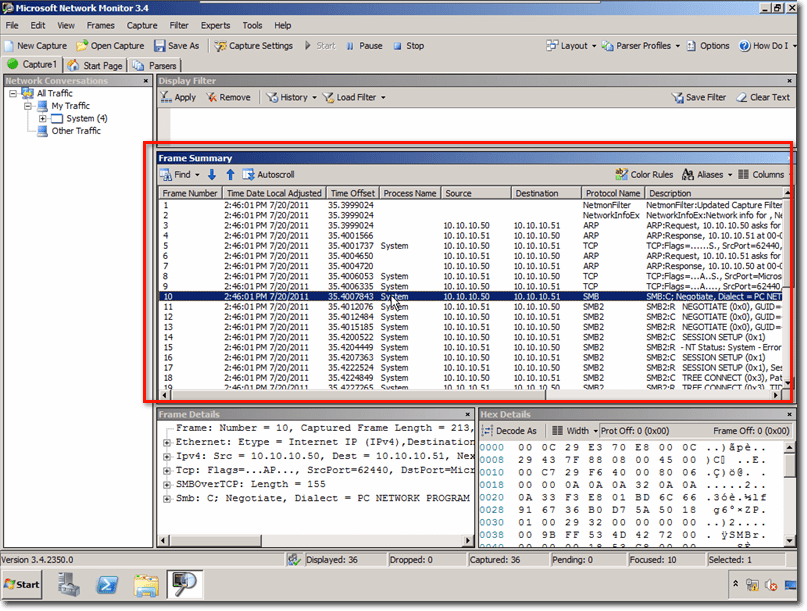
Here’s a typical Frame Summary that includes the traffic generated when the network drive was mapped.
The data packets related to drive mapping are the ones that begin with SMBs (Small Message Block) packets. If, upon mapping the network drive an error occurred and we received an “Access denied” notification, we would have to document the issue.
Your cheat sheet may be a simple Notepad file wherein, for this particular issue, you would jot down the following information:
network drive mapping

 error message - access denied
source ip address = 10.10.10.50

 destination ip address = 10.10.10.51
For more complicated setups, like one where you may be dealing with multiple machines, you may add as many information as you think is necessary. For example, you may want to add a rudimentary graph illustrating what should have happened and where you think the problem might be residing at.
That way, when you get back to this issue in the future, you’ll know what it was all about.
How to customize what information should be captured
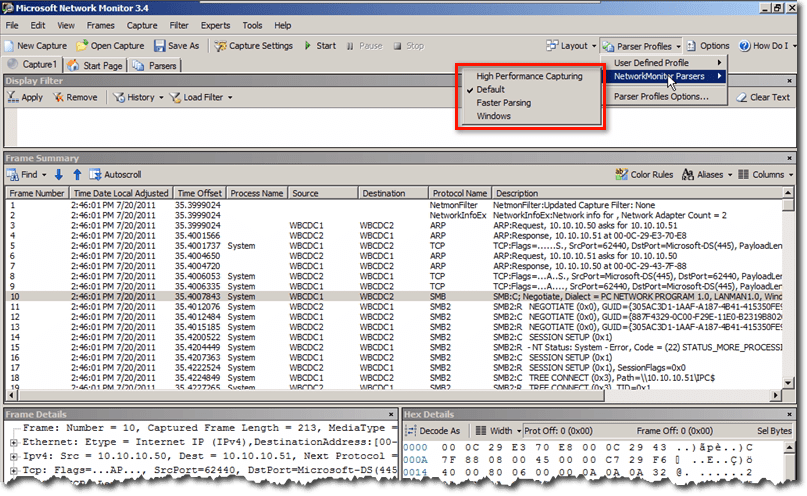
You may specify what information should be captured by choosing a Parser Profile. There are five ready-made parser profiles that you can initially choose from. But if you want, you may also create customized parser profiles.
The 5 ready-made parser profiles are namely:
Pure – performs no parsing and very limited filtering;
HPC (High Performance Capture) – provides optimized filtering speeds but its filtering capability is limited to TCP and UDP protocols and some protocols related to these two.
Faster Pasing – parses more protocols like: ARP, HTTP, DNS, and NBTNS but doesn’t include SMB and SMB2.
Default – This is the default profile, which parses all the protocols mentioned previously as well as SMB, SMB2, and RPC.
Windows – parses every Windows-based protocol plus SQL. It is considered the heavyweight in terms of parsing cost.
Generally speaking, the more data packet details a packet profile has, the slower the trace will be and the longer it will take to generate its view.
Packet profiles are typically set before you begin your trace. To choose a packet profile, just go to Parser Profiles > NetworkMonitor Parsers. There you’ll find the parser profiles enumerated above.
How to customize the user interface
Some of you might want to organize your Network Monitor user interface in a particular way so that only the information you’re interested in are shown and so that they are positioned where they can help you work more efficiently.
Some of the things you can do to organize the user interface include:
- docking and un-docking panes
- hiding unwanted panes
- showing the panes you often need,
- getting the default display settings back, and
- changing the layout of the panes to Simple, Diagnostic, Developer, and the default layout
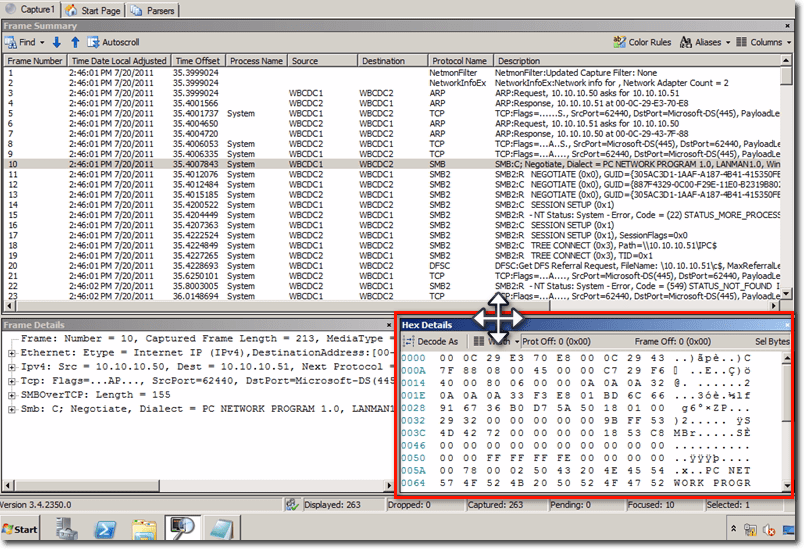
To un-dock a pane, just click on that pane’s title bar, press and hold the SHIFT button, then click and drag the pane out of its docked position. You can then move it to where you want it to be.
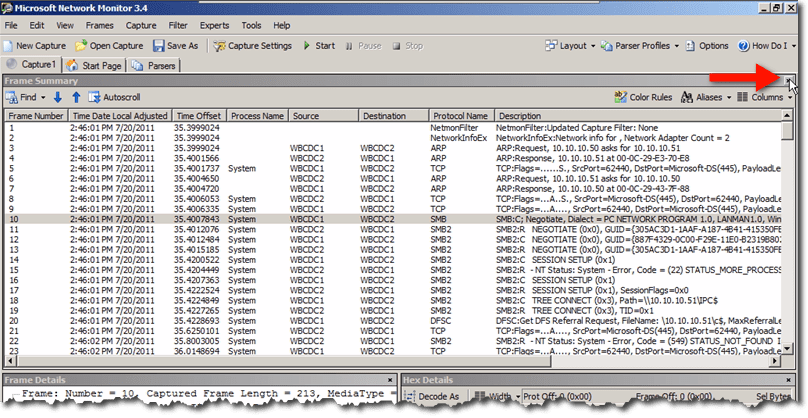
To hide a pane, just click the ‘x’ button on its upper-right corner.
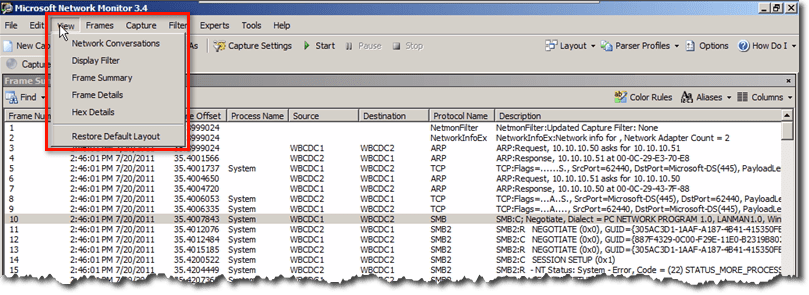
To bring a hidden pane back into view, navigate to the View menu and select the pane you want to show. You will also see a menu item named Restore Default Layout under that menu. Clicking that will restore the layout back to its default settings. You’ll need this if you’ve moved a lot of things around and later on realize you don’t want the new layout after all.
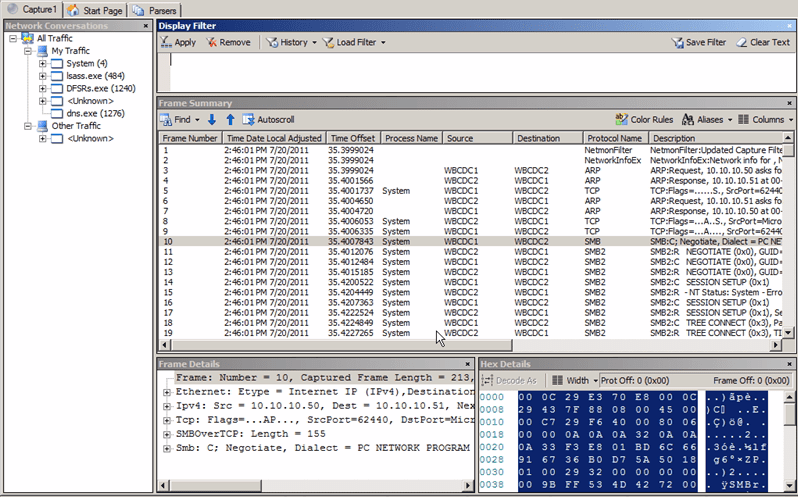
Here’s how the Default Layout looks like.
In addition to the Default Layout, there are also other pre-configured layouts to choose from. To use those layouts, just navigate to the Layout menu and select a layout from there. Notice that the Restore Default Layout can also be selected from that menu.
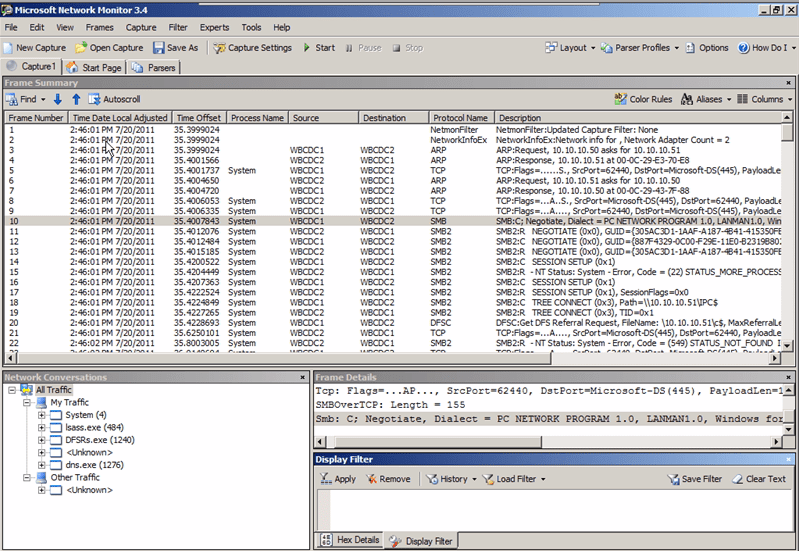
Here’s how the Diagnostic layout looks like. This layout is normally used if, in addition to other information, you want to see as many frames as possible.
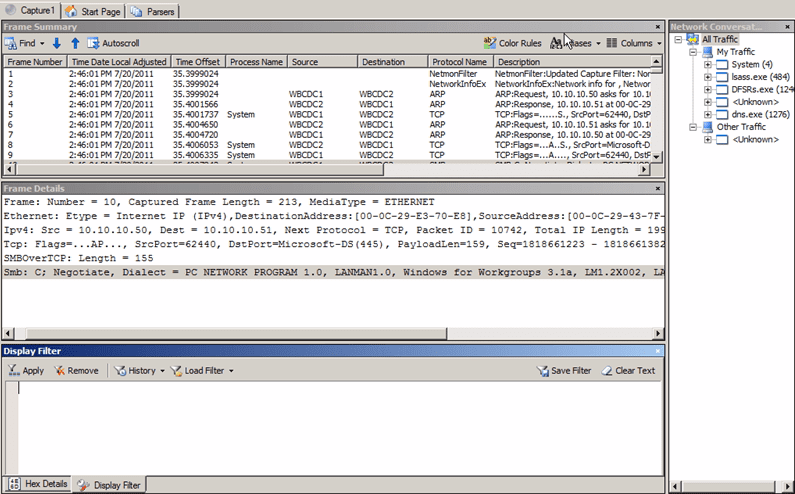
Here’s the Developer layout.
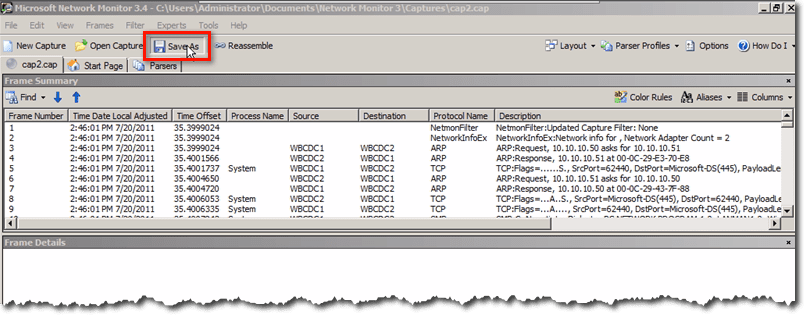
If, after moving panes, removing the ones you don’t like, showing the ones you do, and changing their sizes, you’ve arrived at a customized layout that you really like, you can save that layout for future use. To do that, just click the Save As button.
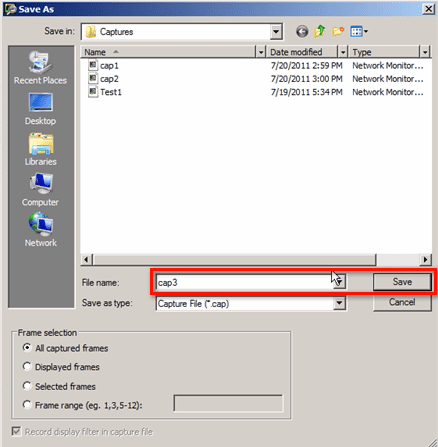
In the Save As window, give the layout a name (e.g. cap3) and click the Save button.
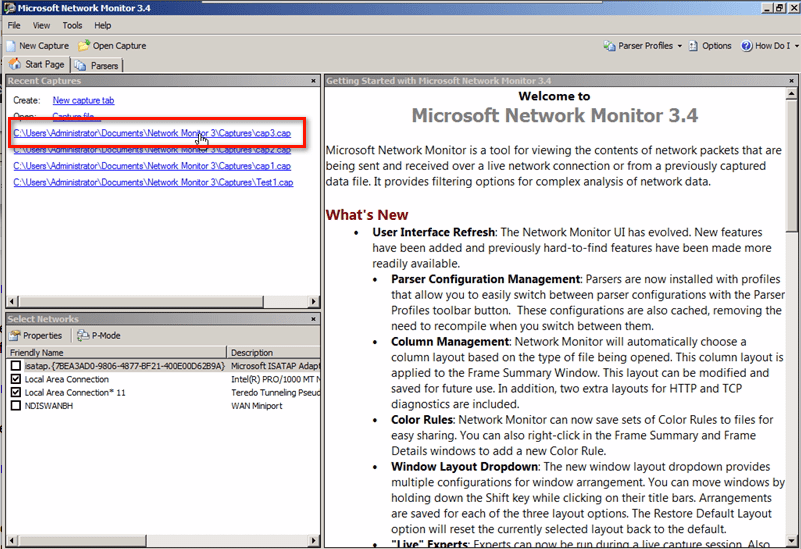
So the next time you launch Network Monitor, you’ll see that file displayed as a link and ready for use.
Conclusion
You’ve reached the end of Part 1 of Microsoft Network Monitor. In Part 2, you’ll learn:
- How to make sense of the captured data
- How to get more information out of the data that’s captured
- How to view specific frames in an XML format and in a window by themselves


