Create InfoPath Repeating tables for SharePoint with PowerApps
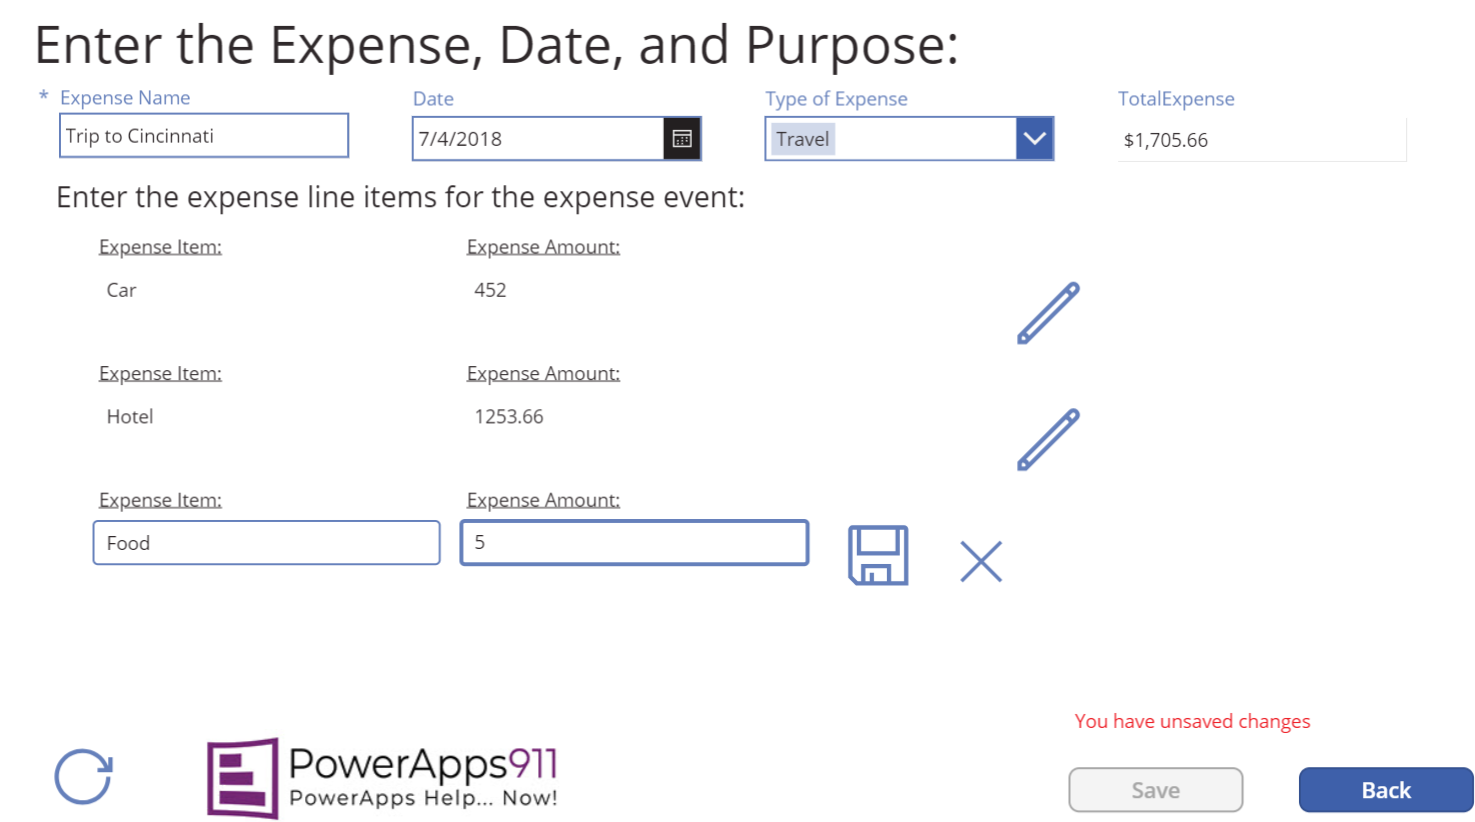
Finally, I have a real answer to the most common question I have received since dedicating my life (over dramatic?) to PowerApps. How do you create InfoPath repeating tables with PowerApps? The answer is you use some really fancy, customized galleries.
There have been a lot of quasi-solutions to this problem, but when I looked at them, I didn’t like them. They were very manual for the person doing data entry. Nobody wants to click a mouse when trying to enter a lot of data. So this solution is focused on easy data entry using the tab key, allowing inline edits and deletes, and making sure we don’t let users submit partial data. Cool! And more importantly, it is super flexible for you the app builder.
The secret sauce
It turns out the other solutions were all form driven because it was easy for the app builder. But the forms caused the clumsiness for the end user. To overcome this, we will use a gallery and a form connected to two different lists. The form for creating the single line item master record and the gallery for the repeating sections. The great thing about the gallery is they are super flexible and let you do almost anything you want. Letting you build the data entry experience your users want.
With our gallery in tow, we feed the gallery a collection instead of our data source. The great thing about the collection is every time we add a new row the gallery will display it. So, to make our table “repeating” we have our save button add a new blank row. Boom! Repeating table.
The collection has a few purposes also. It allows us to store the data the user enters of course but it also stores some data to drive our functionality. Things like the status of the row, whether or not the user has modified the row, and other information. All of this is used to facilitate the app’s functionality without being written to our data source.
Throw in some conditional formatting to hide and show buttons as the user works through the process, and you are in business. None of these are required but they are that extra 10% that keeps your users out of trouble and your phone from ringing.
Once you have all the data, you need to submit it all. Now you could try to do a Collect(YourCollection, YourSharePointList) but that will only work if you want to match columns between the two. I actually started with that solution and decided I didn’t like it. Better for me was to combine Patch and ForAll.
Patch is a PowerApps function for either adding a record or for editing it. ForAll is a function for iterating through a table (a collection in this example) and running the same function (Patch in this example) once for each row. So you end up with something like this:
ForAll(ExpenseItemsCollection, Patch(ExpenseDetailsSharePointList, Defaults(ExpenseDetailsSharePointList), { ItemCost: Value(LineCost), Title: LineItem, MasterID: IDofTheMasterRecord}))
That function will add all of the expense line items to your SharePoint list from the collection. So, if ExpenseItemsCollection has ten items, then the Patch function will run ten times, once for each record. Kind of cool. For bonus points, you can use the Sum function to auto calculate the total for the user.
There you go with a little (okay a lot) of elbow grease you can now use galleries to make a repeating section like functionality with PowerApps.
Not just for SharePoint
When I think about these solutions, I always think of SharePoint but I shouldn’t. This solution would work the same if you were using SQL Server, Excel, or anything else as your data source. Also, remember that one of the beauties of PowerApps is you can easily have multiple data sources. So maybe the expense master items are written or pulled from a line of business database, and the expense line items are stored in SharePoint. Kind of crazy, but possible.
I will also steal a few seconds from you to remind you that SharePoint is not always the best data source. Why? One word, delegation. Delegation is the behavior that by default SharePoint will only let you work with the first 500 records for most queries. Yes, you can increase that to 2,000 items but no. For this app that I built on SharePoint, I had to work around all of the SharePoint weirdness of delegation. If you want my two cents to find a different data source. Either Azure SQL database as a service or look at the common data service (CDS). Both would make a better solution
How do you build this whole solution
I thought you would never ask. Instead of writing a 50,000-word article walking you through all of the steps to recreate this magnificent solution instead I made a video series. Yes, it took three videos to build this one solution. Why? There is a lot going on. I will not even tell you how many days of work it took me to figure out this crazy solution. Either way, go watch and enjoy. This example is an expense report, but I could see the same for time sheets, order forms, quoting apps, and more.
PowerApps Repeating Tables like InfoPath Part 1 – Enter the data
PowerApps Repeating Tables like InfoPath Part 2 – View and edit the data
PowerApps Repeating Tables Like InfoPath Part 3 – Inline editing


