What Is Azure Monitor? – Optimizing Your IT Infrastructure
Managing and monitoring IT infrastructure in today’s cloud-driven world requires tools that unify insights, scale across hybrid environments, and provide actionable intelligence.

In this guide, we’ll explore Azure Monitor’s key components, advanced features, and use cases while integrating practical examples, KQL (Kusto Query Language) insights, and best practices. By the end, you’ll know how to leverage Azure Monitor to optimize resource performance, ensure availability, and reduce costs.
What is Azure Monitor?
Microsoft Azure Monitor is a comprehensive monitoring solution for Azure, on-premises, and multi-cloud resources. Azure Monitor is a unified Azure services platform that collects, analyzes, and acts on telemetry data from your IT environment. It delivers metrics for near real-time performance monitoring, log data for in-depth analysis, and rich notifications.
From virtual machines (VMs) and Azure Functions to on-premises resources integrated via Azure Arc, Azure Monitor provides a single pane of glass for visibility and insights.
How Azure Monitor collects monitoring data
Azure Monitor’s data collection capabilities are its backbone. It ingests telemetry from multiple layers, including:
- Azure Resources: Metrics and logs from VMs, storage accounts, Azure Logic Apps, and Azure Functions.
- Guest Operating Systems: Data collected using the Azure Monitor Agent (AMA) or Log Analytics agents on servers running either the Linux or Windows operating systems.
- Applications: Application Insights offers end-to-end monitoring for distributed applications, capturing response times, dependency failures, and user sessions.
- Custom Sources: APIs allow ingestion of telemetry from third-party tools or non-Azure environments.
Data is categorized into:
- Platform metrics for performance tracking, such as CPU usage and memory consumption. Metrics refer to time-sampled numerical values.
- Logs for rich, queryable telemetry that helps troubleshoot issues and analyze trends.

Pro Tip: Use diagnostic settings in the Azure portal to configure where data is sent (e.g., Log Analytics workspace, Event Hubs, or Azure Storage). You can also configure data retention for each service.

Key features of Azure Monitor
Let’s look at the three key features of Azure Monitor.
1. Action Groups and Alerts
Action groups in Azure Monitor enable IT teams to respond dynamically to operational issues. They integrate with services like Azure Functions and Logic Apps to automate remediation tasks.
Example Use Case: Configure an alert to scale up virtual machines when CPU usage exceeds 80%, ensuring your workloads run efficiently during traffic spikes. Or use Azure Service Health alerts to be notified and take action if there’s a disruption to your Azure tenants and Azure cloud services.

2. Azure Monitor Logs and Log Analytics
Azure Monitor Logs offer unparalleled depth for analyzing telemetry data. By querying logs using KQL, you can uncover patterns and pinpoint root causes.
KQL Example Query:
AzureActivity
| where OperationName == "Delete Virtual Machine"
| summarize Count = count() by ResourceGroup, bin(TimeGenerated, 1d)
This query identifies when VMs were deleted, grouped by resource group and day, making it easier to trace unauthorized changes.
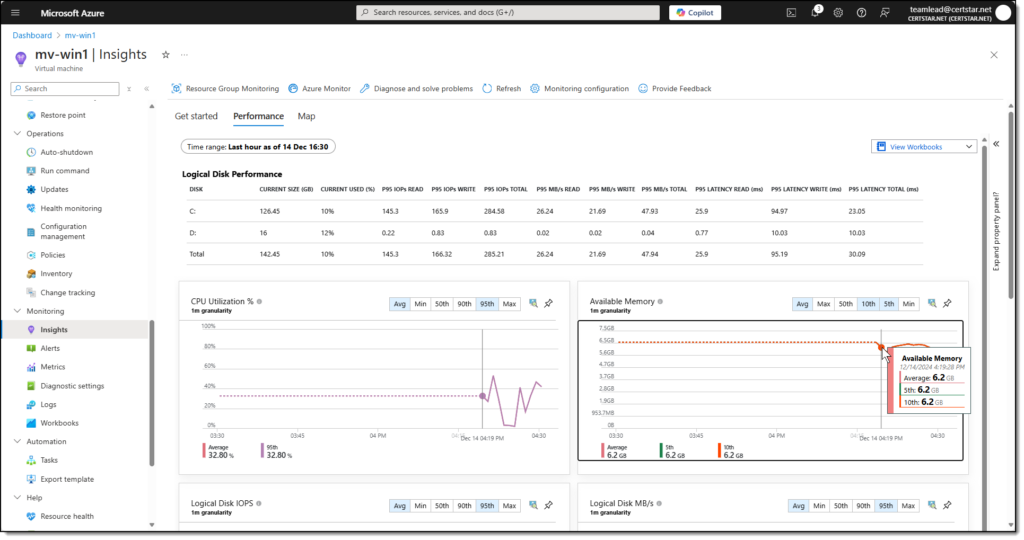
3. Visualizations and Dashboards
Azure Monitor includes built-in visualization tools:
- Metrics Explorer: Graphical representations of metrics over time.
- Workbooks: Customizable templates for creating detailed visual reports.
- Azure Dashboards: Consolidate metrics and logs into a single, digestible view.
For advanced analysis, integrate Azure Monitor with Power BI to generate executive-level reports.

Azure Monitor for hybrid and multi-cloud environments
One of Azure Monitor’s standout features is its ability to monitor hybrid environments using Azure Arc. This integration extends monitoring capabilities to on-premises servers, Kubernetes clusters, and third-party clouds.
Use Case: A financial organization running applications across Azure and AWS can centralize monitoring through Azure Monitor, ensuring consistent insights into system performance and security.
Log Analytics: Diving deeper into logs
The Log Analytics workspace is the powerhouse behind Azure Monitor Logs. It supports custom log queries to extract detailed insights. For example:
Example Query for CPU Spikes:
Perf
| where ObjectName == "Processor" and CounterName == "% Processor Time"
| summarize AvgCPU = avg(CounterValue) by bin(TimeGenerated, 1h)
| order by AvgCPU desc
By correlating this data with resource logs, IT professionals can pinpoint the root cause of performance issues. Use Azure alerts or Logic App workflows to mitigate issues in real-time.
Common questions about Azure Monitor
Here are the answers to some common questions people usually have about Azure Monitor:
- What is the difference between Azure Monitor and Azure Sentinel? Azure Monitor focuses on operational monitoring, while Azure Sentinel is a SIEM tool for security threat detection and response.
- What is the role of Azure Monitor Logs? Azure Monitor Logs provide historical telemetry data for root-cause analysis, trend identification, and compliance auditing.
- Can Azure Monitor work with non-Azure resources? Yes! Through Azure Arc, Azure Monitor extends capabilities to on-premises servers and third-party cloud resources.
Advanced scenarios: Monitoring complex systems
Here are some advanced situations where Azure Monitor can be applied.
Container insights
Azure Monitor offers specialized tools for Azure Kubernetes Service clusters via Container Insights. IT teams can track pod performance, view Prometheus metrics, and analyze container resource usage.
Integration with Azure Functions
Azure Functions generate metrics like execution counts, errors, and response times. By integrating these metrics into Azure Monitor, developers can fine-tune their serverless applications.
Resource logs and activity logs
Resource logs track events at the resource level, while activity logs provide visibility into control-plane operations, such as resource deployments and access changes.
Example: Use activity logs to audit who made changes to an Azure subscription’s configurations.
Best practices for using Azure Monitor
Like any tool, there are a few best practices that you should follow:
- Leverage Azure Policy: Enforce consistent configurations across Azure subscriptions to ensure all resources send diagnostics data to Azure Monitor.
- Optimize costs: Analyze ingestion rates for metrics and logs to avoid excessive costs. Use retention policies to manage log storage effectively.
- Set threshold alerts: Use dynamic thresholds in alert rules to adapt to seasonal or application-specific performance variations.
Cost management with Azure Monitor
Azure Monitor plays a crucial role in optimizing cloud costs:
- Monitor underutilized VMs to identify cost-saving opportunities.
- Track ingress and egress data from Azure Storage accounts to understand bandwidth usage.
Integrating Azure Monitor with Azure Cost Management provides a complete picture of resource consumption and costs.
Additional learning resources for Azure Monitor and KQL
To master Azure Monitor and KQL, here are some excellent resources and tools to enhance your skills:
- Kusto King: A comprehensive blog and learning platform for all things KQL, managed by a leading KQL expert. Includes tutorials, tips, and real-world examples
- Kusto Detective Agency: An interactive and gamified platform by Microsoft to help learners explore KQL through challenging scenarios
- Azure Monitor Logs Documentation: Official Microsoft documentation covering everything from basic log collection to advanced query techniques in Azure Monitor.
- Log Analytics Query Language (KQL) Reference: A quick-reference guide for crafting effective KQL queries, including operators, functions, and syntax rules.
- Azure Log Analytics: A step-by-step tutorial on using Log Analytics for troubleshooting and performance analysis.
These resources will help you expand your understanding of Azure Monitor, Log Analytics, and the power of KQL for data-driven insights.
A strategic platform for ensuring the health, performance, and security of your IT ecosystem
Azure Monitor is more than just a monitoring tool—it’s a strategic platform for ensuring the health, performance, and security of your IT ecosystem. By mastering its components, from metrics and logs to hybrid monitoring via Azure Arc, IT professionals can proactively address issues, optimize configurations, and align IT performance with business objectives.
Call to Action: Ready to get started? Explore Azure Monitor in your environment today. Begin by enabling diagnostics for key resources and diving into Log Analytics to uncover insights that will transform your operations.
Tim Warner is a seasoned IT professional and educator with extensive experience in Microsoft Azure, PowerShell, and cross-platform solutions. As a contributor to Petri, Tim breaks down complex technical concepts into accessible, practical insights fo...

