Azure Monitor: Creating Alerts
In today’s Ask the Admin, I’ll show you how to set up alerts in Azure Monitor.
In Azure Monitor: Creating Metrics on the Petri IT Knowledgebase, I showed you how to set up metrics in Azure Monitor. The last piece of the Azure Monitor puzzle is to set up alerts, and in this article, I’ll show you how to do that using a metric as source information, so be sure to look at the article on metrics that I previously mentioned.
Configure Alerts
Before following the steps below, you’ll need access to an Azure subscription. If you don’t have one, you can sign up for a free trial here.
- Log in to the Azure portal here using an administrator account for the tenant.
- Click Monitor in the list of options in the left pane of the Azure portal. Monitor will appear in the list if you followed the instructions in the previous Azure Monitor article on Petri. If it doesn’t, click More services at the bottom of the list, and type monitor in the Filter box to access Monitor.
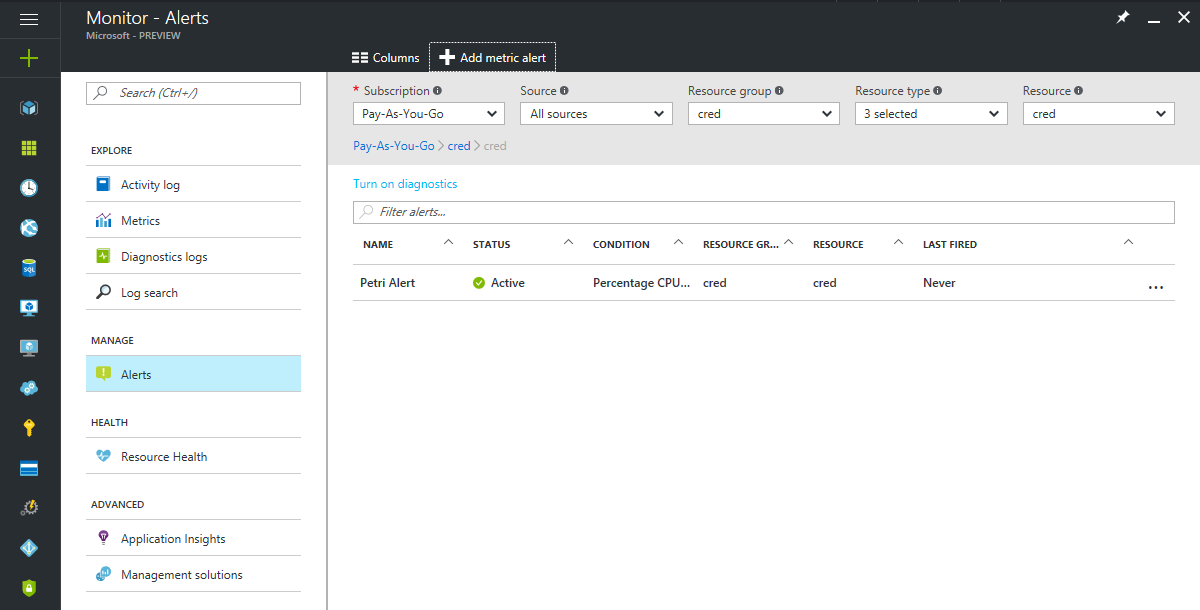
- Under MANAGE in the Monitor – Activity log panel, click Alerts.

Alternatively, if you want to create an alert using a metric as the information source, you can click + Add metric alert after creating the metric as described in Azure Monitor: Creating Metrics.
- In the Monitor – Alerts panel, select the subscription you’d like to set up alerts for from the Subscription drop-down menu.
- For the time being, leave All sources selected in the Source menu.
- Select the resource group, where the resource you’d like to set up alerts for is located, from the Resource group drop-down menu.
- Using the Resource type menu, select or deselect the types of resources you’d like to receive alerts for.
- Select one or more resources for which you’d like to receive alerts in the Resource menu.
- Click + Add metric alert above the drop-down menus at the top of the Monitor – Alerts panel.
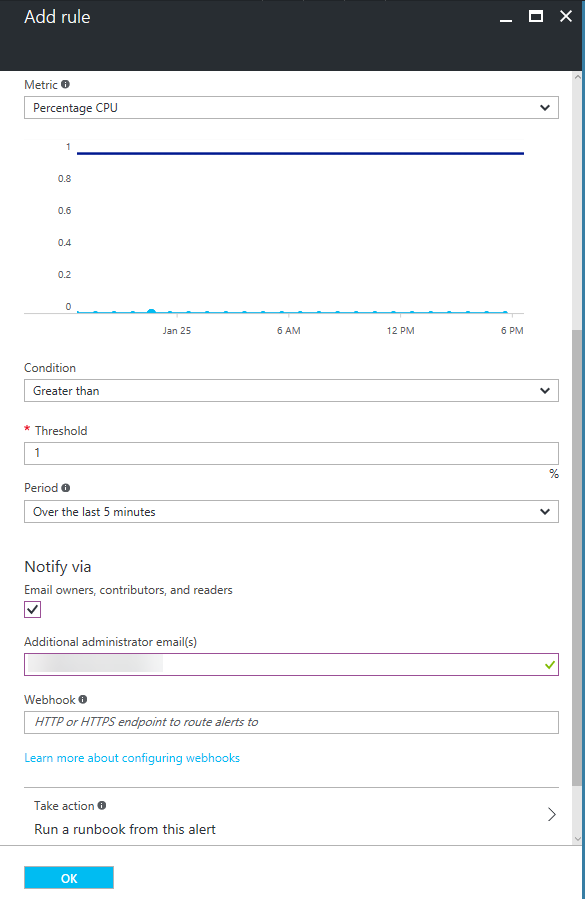
- In the Add rule panel, give the new alert rule a name.
In this example, in the Source section of the Add rule panel, the Alert on menu is set to Metrics. I can’t change this because diagnostic logging for the VM is not enabled. Additionally, because diagnostic logging is not enabled for the VM, there’s a limited set of metrics available to choose from. Although it’s not important for demonstrating how to create an alert, in a production environment you might want to enable diagnostic logging for VMs, which can be done in the Settings panel for each VM.
- The Subscription, Resource group, and Resource fields are already completed with information we previously provided.
- In this example, I’m going to choose the Percentage CPU metric as a source of information for the alert in the Metric drop-down menu. Because diagnostic logging is not enabled for the VM, only host-os-level metrics are shown. For more information on guest-os-level and host-os-level metrics, see Azure Monitor: Creating Metrics on Petri.

- Now let’s set the conditions for triggering an alert. I want to receive an alert when the host OS CPU goes above 10 percent over the past five minutes, so I’m going to choose Greater than in the Condition menu, type 10 into the Threshold field, and select Over the last 5 minutes in the Period drop-down menu.
- To receive notifications, I checked Email owners, contributors, and readers below Notify via, and added my personal email address in the Additional administrator email(s) field.
- Optionally, I can launch a runbook or logic app when the alert is triggered, but I’m not going to do that in this example.
- To set the alert, click OK.
The alert should take a few seconds to create and then appear in the Monitor – Alerts panel. Tenant users that have been assigned the Owner, Contributor, or Reader access role, will receive an alert via email.
In this article, I showed you how to set up an alert in Azure Monitor using a metric.


