Azure Monitor: Logs and Saving Queries
Azure Monitor is currently in preview and can be used to run searches against log information collected from resources across an Azure subscription. Alerts can also be triggered based on metrics that you define. In this article, I’ll show you how to view and filter the activity log, save your queries, and view and enable diagnostic logs.
Viewing Activity Logs and Saving Queries
Let’s start by opening Azure Monitor and applying filters to find information about specific resources. To follow the instructions below, you’ll need an active Azure subscription.
- Log in to the Azure portal here using an administrator account for the tenant.
- In the portal window, click More services in the list of options on the far left.
- Type Monitor in the Filter box at the top of the panel, and click the star icon to the left of Monitor in the results to add it to the list of options on the far left of the portal.
- Click Monitor in the list of filtered results.
- Under EXPLORE in the Monitor – Activity log panel, click Activity log.
In the Activity log pane, you can filter the view to find specific information.
- Leaving all the filter options set to their defaults, click Apply to see all the available logs.

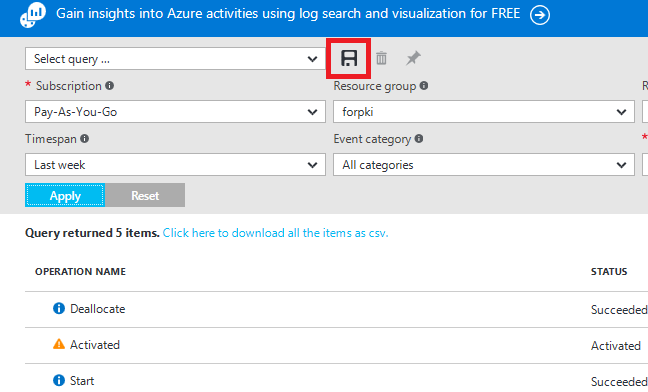
If you don’t get any results, you might need to change the Timespan filter option. I changed it from last hour to last month. Let’s change the filter and specify a Resource Group (RG), and then save and pin the results to create a tile on the dashboard for quick access to a single view of information for operational logs.
- Select a Resource Group from the Resource group filter menu, and click Apply to check you get some results.
- If you’re happy with the filter, click Save to the right of the Select query… menu.

- Enter a query name in the Query name field and click OK.
- Now click the Pin icon to the right of the Save button.
- A notification will appear in the notification center to confirm that the query has been pinned to the dashboard.
- The tile will now appear on the portal dashboard. To access the dashboard, click Microsoft Azure in the top left of the portal window.
Diagnostic Logs
Azure Monitor also allows you to enable and view diagnostic logs for your Azure resources. For example, Windows event system logs are a type of diagnostic log for VMs running Windows Server. Blob, table, and queue logs are available for storage accounts. Diagnostic logs differ from activity logs, which show configuration actions that were performed on resources in an Azure subscription.
- Go back to Azure Monitor by clicking Monitor in the list of options in the far-left pane.
- Under EXPLORE in the Monitor – Activity log panel, click Diagnostic logs.
- Using the drop-down menus at the top of the Monitor – Diagnostic logs panel, choose a Subscription, Resource group, Resource type and Resource for which to display diagnostic logs.
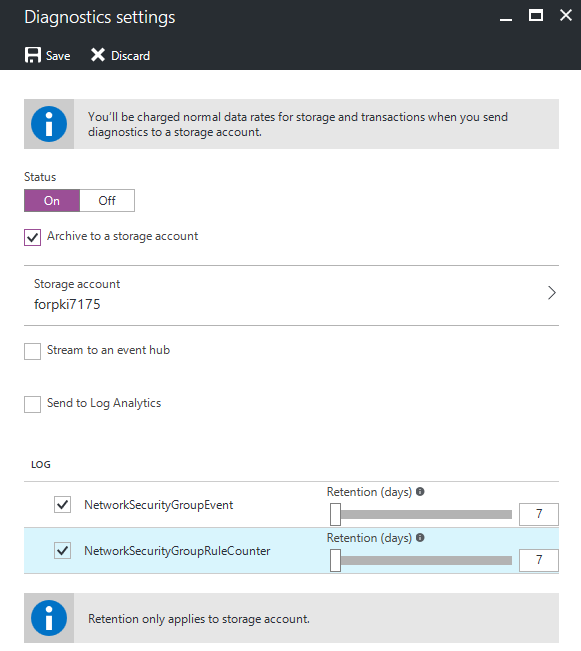
- If diagnostic logging is disabled, click the Turn on diagnostics to collect the following logs link to configure logging.

- Click the On button in the Diagnostic settings window, select Archive to a storage account, choose a storage account, and select logs you’d like to enable under the Logs section.
- Click Save to complete the process.

If diagnostic logs are being stored in a storage account, you will see a list of logs that you can directly download in the Diagnostic logs window. Diagnostic logs can be enabled and disabled individually for each Azure resource.
In this article, I showed you how to view and filter the results of the activity logs, save your queries, and view and enable diagnostic logging. In an upcoming article, I’ll show you how to configure metrics and alerts in Azure Monitor.


