PowerShell Problem Solver: Process Performance For All
- Blog
- PowerShell
- Post
We have covered a lot of ground in this series, but we’ll wrap it up today. In the last PowerShell Problem Solver article, we looked at a variety of ways to get a single performance object for a single computer. The goal was to easily present the average processor time and the top five processes consuming the most processor time. As useful as the examples were in the last article, our jobs would be tedious if we had to manage one computer at a time. In this article, I want you think about management at scale with PowerShell. So let’s take our baby steps with a single server and see what it takes to scale.
- PowerShell Problem Solver: Getting Process Details
- PowerShell Problem Solver: Processor Loads
- PowerShell Problem Solver: Process CPU Utilization
- PowerShell Problem Solver: Process Performance For All
Collecting Data
First, I’ll define a variable for the computers I plan on querying. I’m manually defining a list but you can read in a text file, query Active Directory or import a CSV file.
$computers = "chi-hvr2","chi-dc01","chi-dc02","chi-dc04","chi-core01","chi-web02","chi-sql01","chi-scom01"
As before I’ll be using Get-Counter. I want the same counters I used last time.
$counters = "\Process(*)\% Processor Time","\Processor(_Total)\% Processor Time"
For the sake of demonstration I’m going to collect 30 samples every 2 seconds, which means about one minute of sampling. Naturally you can decide how much sampling you need to get the values you want.
$data = Get-Counter -Counter $counters -ComputerName $computers -MaxSamples 30 -SampleInterval 2
Once this is complete, I need to filter out the counters I don’t want. This is the same command I used in the last article.
$grouped = ($data.countersamples).where({$_.Path -notmatch "\\\\process\((idle|system|_total)\)"}) | Group -property Path
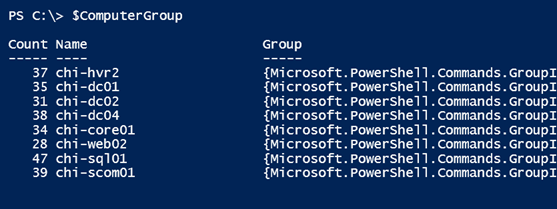
But now things change a little. My data includes counters from multiple computers. Each computername is in the Path property. I know that eventually I will need to create objects for each computer, which means I’ll need to group all of the countersamples per computer. I’ll use a scriptblock with Group-Object.
$ComputerGroup = $grouped | Group –property {$_.name.split("\\")[2]}
Now for the tricky part.
Processing the Data
I need to go through each server in $computergroup and create a custom object for each one. To make it easier to understand, I’ll use the ForEach enumerator.
foreach ($server in $computergroup) {
Since I know I will be using New-Object, I’ll build a hashtable for each server beginning with the computer name.
$hash = [ordered]@{
Computername = $server.name.ToUpper()
}
Next I need to get the average processor time and add it to the hash table.
$processorAverage = ($server.group).where({$_.name -match "\\\\processor"}).Group |
Measure-Object CookedValue -Average |
Select -ExpandProperty Average
$hash.Add('Avg%CPUTime',[math]::Round($ProcessorAverage,4))
I am using the Round() method from the Math class to trim the value to four decimal places.
I now need to get process counter data.
$ProcessAverages = ($server.group).where({$_.name -notmatch "\\\\processor"}).Group |
Group –property InstanceName |
Select Name,@{Name="AvgCPUTime";Expression = {[math]::Round(($_.group.cookedvalue | measure-object -average).average,4)}}
With this, I can get the top five processes using the most CPU time.
$Top = $ProcessAverages | Sort AvgCPUTime -Descending | Select -first 5
At this point, you have to make a decision. How do you want to display the nested process information? I decided to use my technique of defining a property name with an incremental counter.
$i=0
foreach ($item in $Top) {
#increment the counter
$i++
#add each item to the hash table as a separate property
$hash.Add("Process_$i",$item)
}
Finally, I can turn the hashtable into an object and write it to the pipeline.
New-Object -TypeName PSObject -Property $hash
As an alternative, you could also use the [pscustomobject] type accelerator.
[pscustomobject]$hash
Here is the complete final step.
$results = foreach ($server in $computergroup) {
$hash = [ordered]@{
Computername = $server.name.ToUpper()
}
#get average processor utilization
$processorAverage = ($server.group).where({$_.name -match "\\\\processor"}).Group |
Measure-Object CookedValue -Average |
Select -ExpandProperty Average
$hash.Add('Avg%CPUTime',[math]::Round($ProcessorAverage,4))
#get process utilization for the processor
$ProcessAverages = ($server.group).where({$_.name -notmatch "\\\\processor"}).Group | Group InstanceName |
Select Name,@{Name="AvgCPUTime";Expression = {[math]::Round(($_.group.cookedvalue | measure-object -average).average,4)}}
#get top 5
$Top = $ProcessAverages | Sort AvgCPUTime -Descending | Select -first 5
#add the processes to the hashtable
$i=0
foreach ($item in $Top) {
#increment the counter
$i++
#add each item to the hash table as a separate property
$hash.Add("Process_$i",$item)
}
#Create custom object
New-Object -TypeName PSObject -Property $hash
#or you can use [pscustomobject]$hash
}
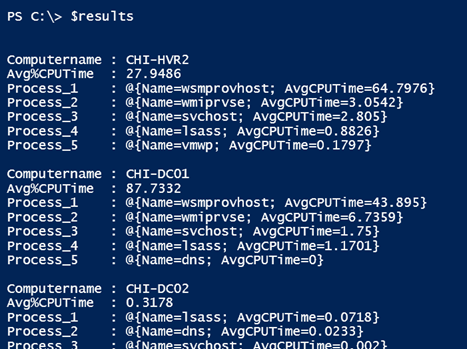
An important note about using the ForEach enumerator is that it doesn’t write objects to the pipeline in the way that ForEach-Object does. By that I mean you can’t pipe anything after the closing curly brace ( } ). That’s why for my demonstration I’m assigning the results to a variable $results. But this is completely optional. I’m doing it so I can show you different ways to use the results.
If you recall, I stressed the importance of writing one type of object to the pipeline. This is so that I can run expressions like this:
$results | select Computername,Avg*,Process_1 | format-table -AutoSize
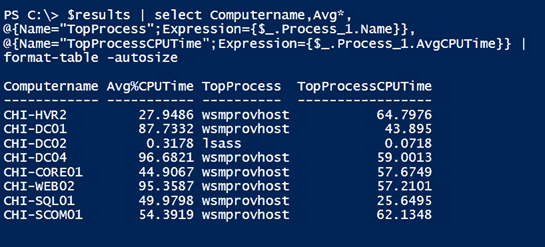
Or I can break things down.
$results | select Computername,Avg*,
@{Name="TopProcess";Expression={$_.Process_1.Name}},
@{Name="TopProcessCPUTime";Expression={$_.Process_1.AvgCPUTime}} |
format-table -autosize
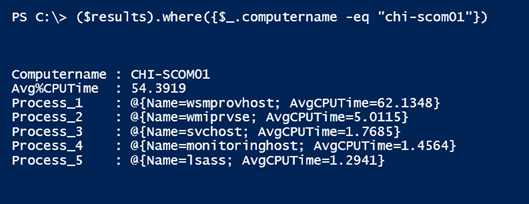
I can even filter for a specific computer.
I have stepped through the process, but you can take it to the next step and create a script or function. In fact, there are several items that come immediately to mind that you could also incorporate into the output:
- the sampling date
- number of samples
- sampling interval
- the number of physical processors
- the number of processor cores
- the computer operating system
As long as you think about objects in the pipeline, there’s no limit to what you can come up with Windows PowerShell.


