Understanding PAL Reports to Identify Windows Storage Bottlenecks
Previously, in an article called “Leveraging PAL to Troubleshoot Windows Storage Performance Issues”, a tool known as PAL (Performance Analysis of Logs) was introduced. PAL is used in conjunction with Perfmon performance counters to generate an HTML report that highlights which counters have exceeded pre-determined thresholds. By using hyperlinks, the report quickly takes you to graphs and charts which reflect the potential performance bottlenecks.
PAL Reports Unveiled
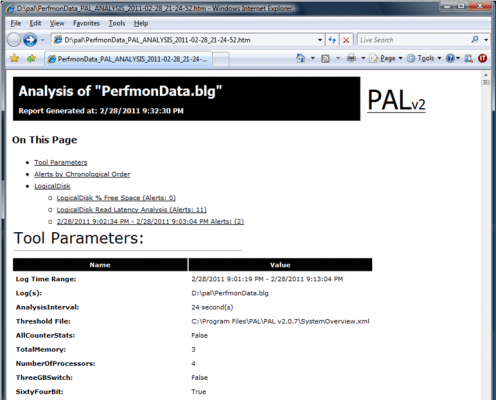
After executing the PAL wizard, a job is executed which reads the Perfmon log file (counters) and compares the values to pre-determined thresholds. Any values that exceed the thresholds are flagged in an HTML report that can be read by any web browser. The PAL report begins by listing the tool parameters that were collected by the wizard to specify the server configuration and threshold profile used in the report:
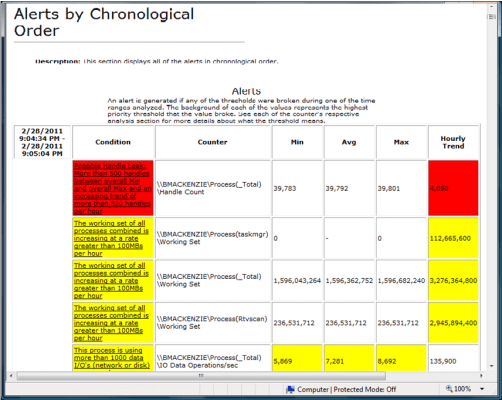
Next, a listing of the alerts that triggered the threshold values are chronologically presented in the report. This allows you to quickly focus on the time period when the majority of bottlenecks occurred. Each alert contains a hyperlink so you can expand the details associated with each event, such as the corresponding graph of the counter along with an explanation and when each occurrence exceeded the threshold. A color-coded severity is given to each alert indicating if it is normal (green), a warning (yellow), or reason for concern (red). The following example illustrates the alerts by chronological order:
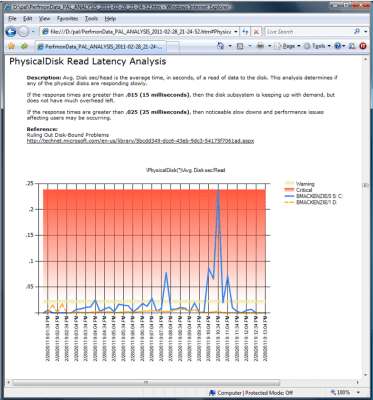
In the next section of the report, the graphs for each of the relevant performance counters are given, along with a detailed explanation of the counter and why it is significant. Helpful hints are provided when troubleshooting the bottleneck along with additional references for further documentation. Most storage related problems begin with a perception of slow response for disk reads or writes. What follows is an example graph displaying Physical Disk Read Latency, a description of the counter and any thresholds. You can quickly see that disk C: is encountering high spikes of I/O activity that should be investigated further.
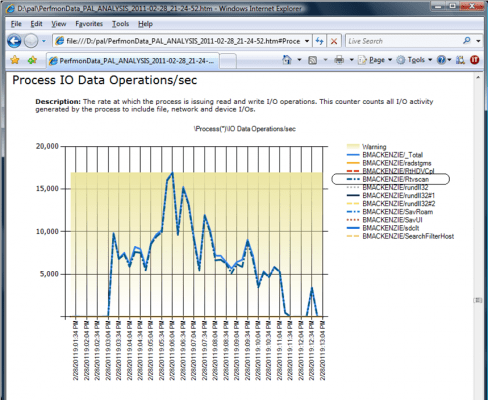
Looking at the Process performance counter graphs, you can quickly determine which process is generating all the I/O Data Operations. In the following graph, you can see the Rtvscan process (realtime virus scanner) is consuming I/O Data Operations at a rate of over 15,000 per second. This clearly accounts for the poor performance associated with Disk C.
While this example was contrived in nature by initiating a virus scan on Disk C, it illustrates how you can use PAL to quickly focus on what application or device is involved with the underlying performance issue.
Summary
Troubleshooting storage performance issues can be a daunting task, often requiring many hours to review the performance metrics. PAL is a free tool that automates the analysis by comparing performance metrics to pre-determined threshold values. A report is produced that quickly allows you to examine bottlenecks with detailed graphs and explanations.
The latest versions of Performance Analysis of Logs (PAL 2.0) now use PowerShell instead of VBScript. As the tool continues to evolve, it has rapidly become a favorite in my toolbox and hopefully it will soon be in yours! Watch for future troubleshooting articles on another free tool from Microsoft called Xperf which allows you to dig even deeper into Windows storage performance issues.


