Microsoft’s New Azure Managed Grafana Service Improves Data Visualizations

Microsoft’s Azure Managed Grafana service that launched in preview back in April is now generally available for enterprise customers. The new data visualization solution brings together charts, alerts, and logs that enable IT admins to analyze application and infrastructure telemetry data in a single dashboard.
Grafana is an open-source platform that lets organizations unify, collect, and visualize data collection from their applications. Previously, Microsoft Azure customers used the open-source product to deploy Grafana in their environments. However, it was a resource-intensive process that required customers to manage everything in-house.
Last year, Microsoft and Grafana Labs announced a strategic partnership to make Grafana natively compatible with the Azure cloud platform. Microsoft’s new Azure Managed Grafana service has native integrations with several cloud services, including Azure Monitor and Azure Data Explorer. It makes it possible to connect to any resource and observe all telemetry information in the Grafana dashboard.
“With Azure Managed Grafana, you can seamlessly and securely connect with and scale to businesses’ existing Azure services, enhancing observability and cloud management,” Microsoft explained.
Azure Managed Grafana adds new integrations with Azure services
Microsoft has updated Azure Managed Grafana to version 9.0, which adds an improved alerting tool to notify IT admins about potential technical issues. This release also brings support for an API key and zone redundancy.
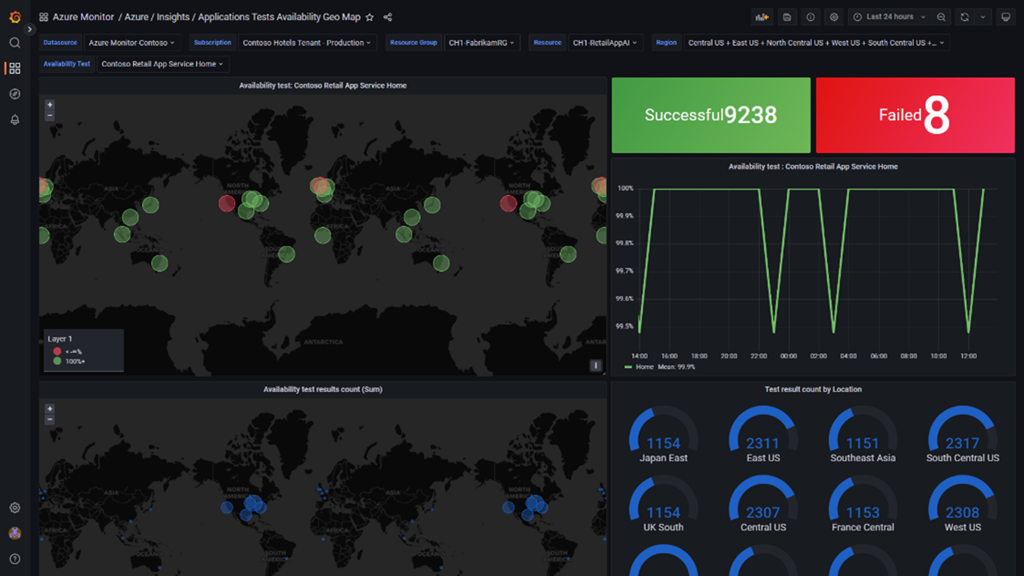
In addition, Microsoft has also introduced new out-of-the-box dashboards for Azure Monitor. For instance, the Availability Tests Geo Map dashboard lets IT admins monitor the availability and responsiveness of their app based on geographic location. Moreover, it is also possible to monitor load balancers that help optimize an organization’s traffic.
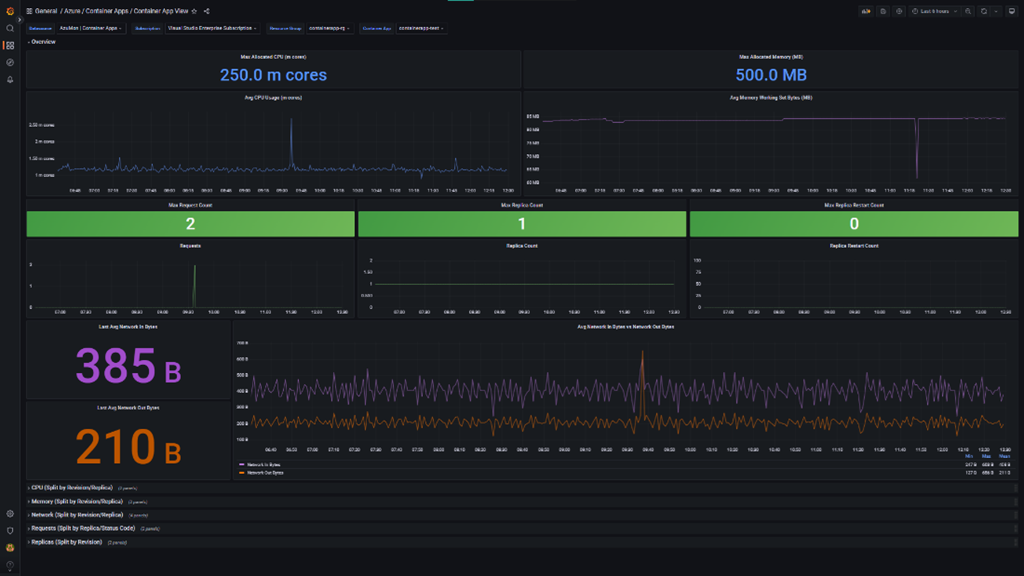
Microsoft has also added new dashboards that help to monitor the performance of workloads running on Azure Container apps, such as CPU and memory usage, network traffic, restarts, and more. Azure Managed Grafana is also getting a new feature that lets users pin Azure Monitor Logs charts and queries to Grafana dashboards.
If you’re interested, you can head to the Azure portal to sign up for a free 30 days trial. You can also check out the Azure Managed Grafana website for more details.

Rabia has a master's degree in Software Engineering and she has years of experience writing professionally about Microsoft products and other technologies. Rabia has also written for OnMSFT.com as well as Windows Report. She is always up to date on t...