What is Grafana: The Ultimate Guide

In today’s DevOps era, most organizations use hundreds of different services. Monitoring all of these is crucial for keeping your systems running without any issues. And one of the most widely used service monitoring tools is Grafana.
In this ultimate guide, we will give you a complete overview of Grafana, so let’s get started!
What is Grafana?
Grafana is an open-source tool that allows you to query, visualize, analyze, and receive alerts on metrics and logs, no matter where they are stored. It also allows you to query data and it supports dozens of visualizations.
Grafana comes with rich support for many databases like Graphite, Prometheus, Elasticsearch, and Influx DB. And it supports various cloud monitoring solutions such as Amazon Cloud Watch, Microsoft Azure, SQL, Postgres, and MySQL databases.
? See what a Grafana Dashboard looks like and all the features it has.
What is Grafana used for?
Although Grafana provides lots of features on its dashboard, the main use of Grafana is to collect data from various data sources and then visualize the data. It can also notify you of issues once you have configured alerting.
Collecting data
Grafana collects data from various sources, which you will learn about later in the guide. Grafana uses APIs to collect data. As an example, the GET /api/datasources API is used to collect data.
Visualizing data
When it comes to visualization, nothing can beat Grafana. It provides dozens of visualizations in various formats such as tables, bar charts, and many more. We’ll discuss the most important visualizations later in this guide.
Grafana dashboard features and functions
Grafana provides hundreds of useful functions to build a strong monitoring dashboard. Let’s jump into this interesting section and look at the great features and functions that Grafana provides.
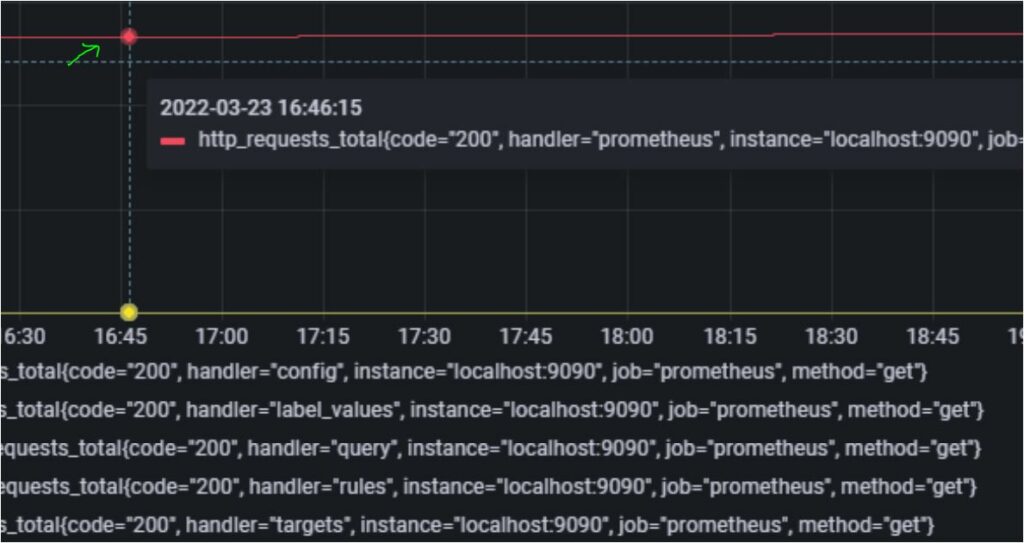
- The Grafana dashboard has a variety of features, and one of them is annotations. With annotations, you can easily mark points to add information accordingly.
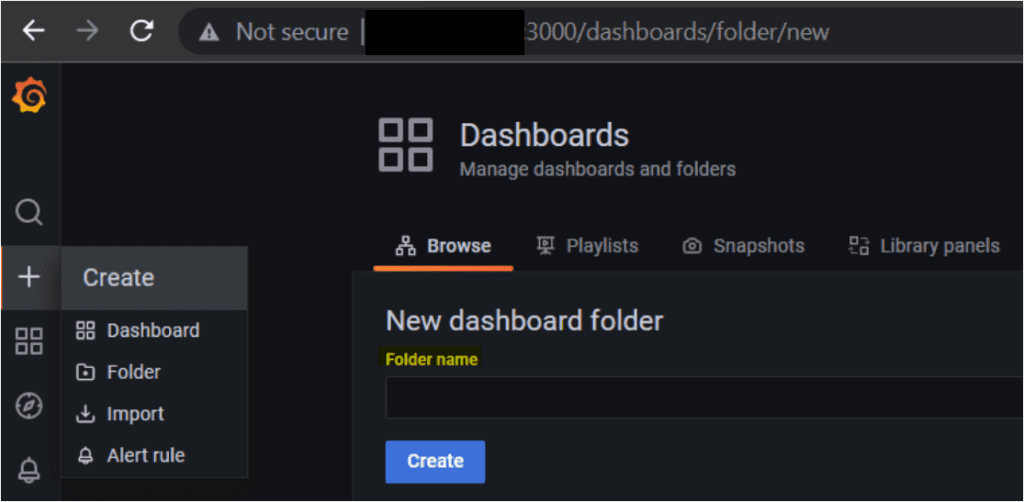
- The dashboard provides a great way to structure your folders and subfolders. You can store data according to teams or projects. Also, you can create folders, move, and delete dashboards inside folders, etc.
- At the top of Grafana, there is a search box where you can specify the dashboard’s name. And as you specify a name, you will see the list of dashboards with identical names.
- Grafana provides dozens of ways to manage the time ranges of the data you want to view, as well as alerts based on seconds, minutes, hours, weeks, days, years, etc.
- One of the coolest features in Grafana is the ability to import dashboards in JSON format from public repositories.
Grafana Installation options
You can set up Grafana in two ways:
- Either by hosting it on your own device
- Or using the Grafana cloud service
Grafana is supported on various platforms and it is easy to set up. Grafana can be installed on Debian or Ubuntu, RPM-based Linux (CentOS, Fedora, OpenSuse, RedHat), macOS, and Windows.
Nowadays, applications are deployed mostly using container orchestration tools such as Kubernetes. And similarly, you can deploy Grafana on Kubernetes.
? To test Grafana on the machine where it’s installed, use the curl localhost:3000 command. Also, admin is the default username and password.
Grafana Cloud
Grafana Cloud provides a simple way to get up and running quickly with high availability, all without the need to manage the underlying infrastructure. Grafana Cloud is a SaaS-based service that is highly available, load-balanced, and fault-tolerant, allowing customers to log and visualize metrics.
With Grafana Cloud, you can quickly monitor applications without worrying about the infrastructure. Grafana Cloud also reduces management complexity compared to self-hosting Grafana without restricting choice or control.
? If you wish to monitor your application with Grafana Cloud, get started with a free account. It allows you to access 10k metrics, 50GB logs, 50GB traces, two weeks of data retention, and three users.
What does Grafana Enterprise offer?
Grafana Enterprise is the commercial edition of Grafana. It comes with some additional features not available in the free open-source version. Grafana Enterprise includes authentication options such as GitLab OAuth, Azure AD OAuth, LDAP, Okta, and SAML.
Also, Grafana Enterprise includes integrations with other services such as Datadog, Kibana, App Dynamics, Dynatrace, Gitlab, Honeycomb, Jira, MongoDB, New Relic, Salesforce, etc.
? To install and set up Grafana Enterprise, you will need a trial license, for which you will need to connect with the Grafana Labs Sales Team.
Grafana alerting
When it comes to alerting, Grafana provides a robust and effective solution. Within the Grafana dashboard, you can create rules-based alerts using specific thresholds, and then send alerts to customers based on frequency. Also, you can set a notification policy.
Notifications in Grafana are sent using a messaging template based on the Go templating system, where some fields are evaluated as text while others are evaluated as HTML. Grafana also integrates well with Slack.
With the latest version of Grafana, you can set up alerts based on multiple data sources, such as queries in Prometheus and MySQL. I.e., Grafana lets you aggregate data from multiple sources. Also, the latest version of the product has centralized alerting on a single page.
Types of data sources in Grafana
Grafana supports various data sources such as:
- Alertmanager,
- AWS CloudWatch
- Azure Monitor
- Elasticsearch
- Google Cloud Monitoring
- Graphite
- InfluxDB
- Microsoft SQL Server (MSSQL)
- OpenTSDB
- PostgreSQL
- Prometheus
- Jaeger
- and Test data that you define in the dashboard.
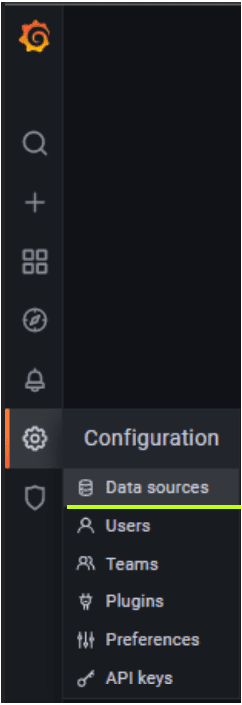
Once you define a data source, you will need to provide specific settings, such as the URL of the data source, and credentials to access it.
Defining a data source is easy. Just go to the Grafana Dashboard→ Settings button → Data sources, as shown below.
Grafana plugins
Grafana supports a handful of plugins. Some of the most widely used plugins are for Influx DB, Prometheus, Pie chart, Stack driver, Tempo, Jaeger, Loki, and Logs.
? If you want to build your own Grafana plugin, then you can use the Grafana Toolkit.
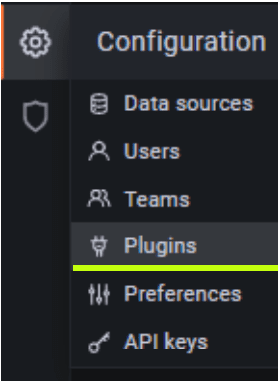
To view all plugins installed in Grafana, go to Settings → Plugins, as shown below.
Grafana API and libraries
There are hundreds of APIs that use their own libraries for management, configuring or setting up Grafana, adding data sources to Panels, etc.
Some of the most important APIs that Grafana uses are listed below:
- Data API Library: work with various data types in Grafana. For example, this library has one function called SortedVector, which returns numbers in a sequence.
- e2e Library: used to execute end-to-end tests.
- UI Library: contains the different design components for the Grafana ecosystem.
Types of data visualization in Grafana
Now you know how useful Grafana is for monitoring and visualization, you might be wondering what Grafana dashboard visualizations look like.
There are many visualizations that Grafana supports:
- Time series is the default and main graph visualization.
- Bar chart shows data based on categories.
- The histogram shows value distribution in a bar chart.
- Heatmap visualizes data in two dimensions. Stat, Gauge, and Bar gauge are used to check the data in number format.
Summary
Grafana is a free tool with a whole lot of features. In this guide, we covered what’s possible with this feature-rich tool. From monitoring interfaces for various data sources, executing queries, and supporting dozens of visualizations, Grafana can do a lot.
Now that you have a good idea about what Grafana does, what do you plan to monitor with it?
Related Articles:

Sagar is a DevOps consultant and the founder of automateinfra.com. Sagar brings DevOps technology expertise to Petri.com, writing about Terraform, AWS Cloud, Microsoft Azure, Ansible, Kubernetes, Docker, Jenkins, Linux, and Windows.