Leveraging PAL to Troubleshoot Windows Storage Performance Issues
Introduction
Continuing on from the previous article covering Free Windows Troubleshooting Tools for Storage Performance, I will now introduce you to a free tool called PAL (Performance Analysis of Logs). PAL is used to automate the analysis of Perfmon counters identifying if they exceed a pre-determined threshold. PAL is especially useful for analyzing storage bottlenecks by quickly identifying the disk or application responsible for the poor performance.
As we previously discussed, the Task Manager is a useful tool for gaining a preliminary analysis of a performance concern. Unfortunately, the Task Manager is an interactive tool that doesn’t allow you to save the performance metrics for subsequent analysis. This can be a problem if your performance issue is an intermittent one that comes and goes.
The Performance Monitor (Perfmon) tool can be used to record performance metrics to a log file as we mentioned last time. This can be advantageous for those intermittent problems. Perfmon also allows you to graph the various performance counters to reveal any bottlenecks. Unfortunately, there are literally hundreds of counters to review which can take hours or even days.
PAL (Performance Analysis of Logs):
In an effort to automate the analysis of Perfmon counters, a tool called PAL was jointly developed by Microsoft and the open source community. PAL is used to read Perfmon counters from a log file and then apply pre-determined threshold values to identify any counters that are flagged as excessive. The tool then produces a report that lists the alerts along with graphs and detailed explanations.
The list of prerequisite software depends on which version of the tool you use. The requirements are thoroughly documented on the Code Plex web site (http://www.codeplex.com/PAL). For earlier versions of PAL (prior to v2.0), the Microsoft Log Parser 2.2 software, along with Microsoft Office Web Components 2003, and .NET Framework 2.0 must be installed. With the current versions of PAL (v2.0 or later), PowerShell v2.0 along with Microsoft .NET Framework 3.5 SP1 is required. The PAL installation is a MSI-based kit with just one prompt for the destination folder.
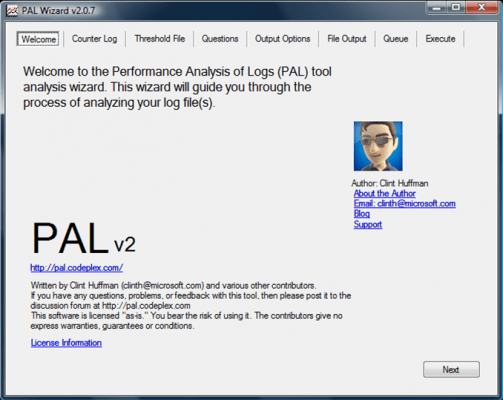
With the earlier version of the tool, a VBS script that utilizes the Log Parser software was used to read the Perfmon log files. With the current version of PAL, a PowerShell script is used to process the data. The GUI interface uses a Wizard to prompt for the location of the Perfmon logs, the threshold file, the analysis interval and the report options. The latest release of PAL is version V2.0.7 which was released in January, 2011 as seen below:
The PAL Wizard
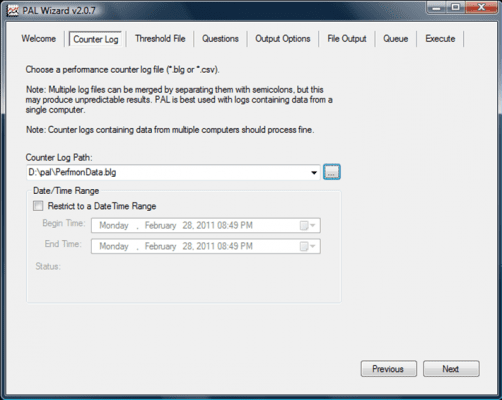
The PAL Wizard guides you through the process of analyzing the performance data. The Perfmon data can be either binary format in BLG log files or comma separated values in CSV log files. The wizard prompts for the location of the log files and whether you want to specify a date/time range. PAL uses the RELOG tool “under the hood” which can be very CPU intensive so a fast processor can help.
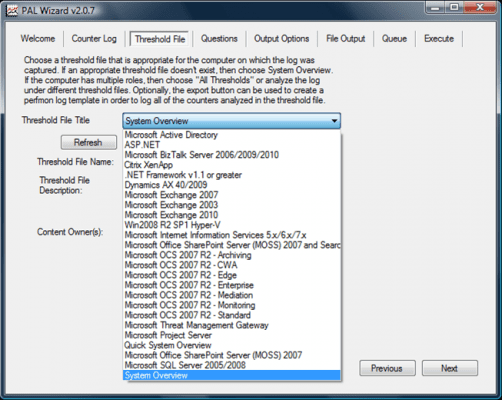
After you provide the location of the Perfmon log file, the next prompt is to specify threshold values to trigger alerts if any counters exceed pre-determined tolerances. This is accomplished by choosing pre-defined threshold files from a list of environments such as SQL, Exchange, Citrix and Hyper-V to name a few. Or, if none of the listed environments match yours, you can choose “System Overview” from the pull-down list for a general set of threshold values, or you can create your own threshold file.
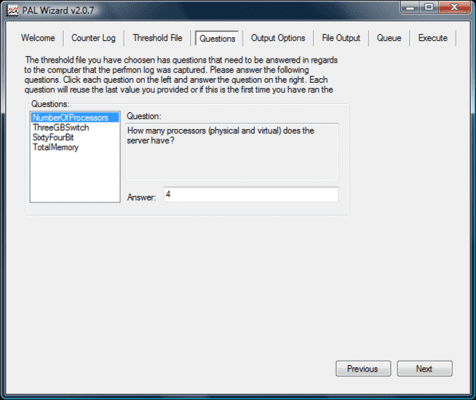
Next, PAL prompts for server configuration information such as the number of processors, the amount of RAM, type of architecture and whether the 3GB boot switch is used.
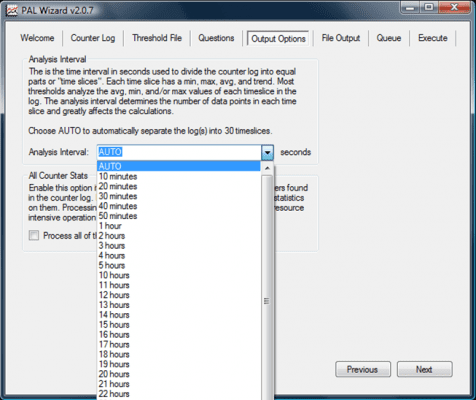
The PAL Wizard then prompts for the analysis interval which affects how many time slices are in the log. If you use the default value of AUTO, the logs will be separated into 30 time slices. Each time slice has a maximum, minimum, average and trend values associated with it. You can also specify that all counters be analyzed, but this is very resource intensive and may take several hours to process.
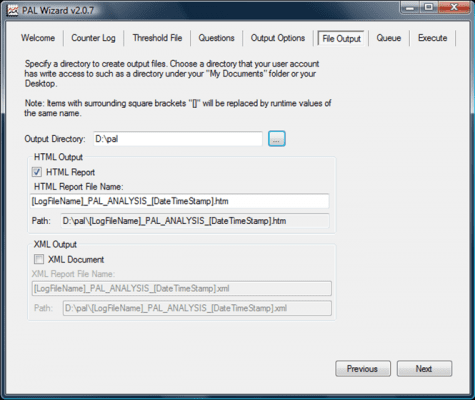
The final wizard prompts include the report output formats either HTML or XML, and the location where the report will be saved. You are also prompted when you want to execute the PAL analysis job as it could take a long time depending on the size of your log files.
Summary
While troubleshooting Windows storage performance issues, there are several free tools from Microsoft that can be used to identify bottlenecks. Built-in tools such as Task Manager and Perfmon are readily available and can assist with a cursory analysis. However, when a more in depth analysis is needed, the PAL tool is a great one to have in your toolbox. This article has introduced PAL and how to install the tool. It has also explored the PAL wizard used to generate graphs and charts. Watch for the next Windows storage troubleshooting article on “Understanding Performance Analysis of Logs Reports to Identify Windows Storage Bottlenecks”.


