3 Ways to Connect to the Office 365 Reporting Service from Excel
In Generate Office 365 Reports using PowerShell on the Petri IT Knowledgebase, I gave you a quick overview of the reporting capabilities in the Office 365 web portal, along with steps on how to run the same pre-defined reports using Windows PowerShell.
In today’s Ask the Admin, I’ll show you one more option for viewing Office 365 reports using Microsoft Excel, which is a good alternative for organizations that don’t want to write PowerShell code, but need to have a solution that’s a little more flexible than what’s available in the portal.
Using the Office 365 Reporting Service
There are three ways to tap into the Office 365 reporting service: using the Office 365 portal, Windows PowerShell or another language, and Microsoft Excel. Keep in mind that each method has its own shortcomings.

Office 365 Portal
Using the pre-defined reports in the web portal is the quickest and easiest way to get started with Office 365 reporting, but there are some significant limitations:
- Not all available information can be returned in the report results.
- Some pre-defined reports are only available using PowerShell.
- You can’t save the results.
- There are only two options for viewing reports: either as a graph or table.
Windows PowerShell
The most flexible way to generate reports is using PowerShell, and it can be used to create custom reports by connecting to the Office 365 reporting service, allowing administrators to determine the data that’s returned, how it’s grouped and sorted, and also the ability to save reports.
Microsoft Excel
The results of the available pre-defined results can be viewed in Excel, by making a connection to the Office 365 reporting service. Custom reports cannot be accessed this way, and the amount of data returned can’t be customized, grouped, filtered or sorted before the results are returned. But Excel can be used to manipulate the results, giving administrators more flexibility than viewing reports in the Office 365 portal.
Connect to the Office 365 Reporting Service from Excel
To get started, you need Microsoft Excel installed on your local management PC, and an Office 365 subscription. Don’t forget that reporting is not available in all plans, so check out Microsoft’s website to see if reporting is available in your subscription. Additionally, not all reports are available in all plans.

- Open Excel, and click Blank workbook to open a new workbook.
- Switch to the Data tab on the ribbon at the top of the worksheet.
- Click Get External Data at the far left of the Office ribbon, and then click From Other Sources.
- Select From OData Feed from the drop-down menu.
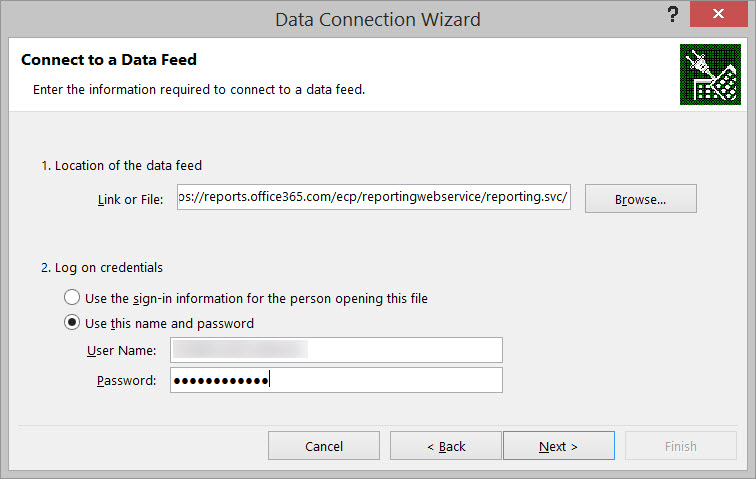
- In the Data Connection Wizard dialog box, type https://reports.office365.com/ecp/reportingwebservice/reporting.svc/ in the Link or File box under Location of the data feed.
- Under Log on credentials, select Use this name and password.
- Enter the credentials of an Office 365 user with permission to generate reports, and click Next.
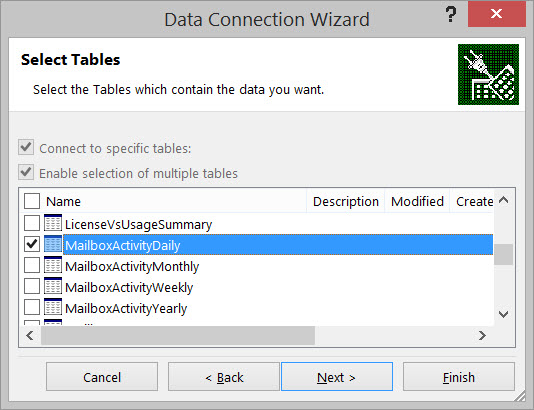
If you are authenticated successfully, you’ll be presented with the Select Tables page, where each table on this page represents a report.

- Select the table that you’d like to import and click Next.
- On the Save Data Connection File and Finish page of the wizard, click Finish.
Alternatively, you can change the location of the data connection file, which is saved by default in the My Data Sources folder. It’s also possible to save the password for the data feed in the file, by checking Save password in file.
- In the Import Data dialog, select PivotTable Report, and then click OK.
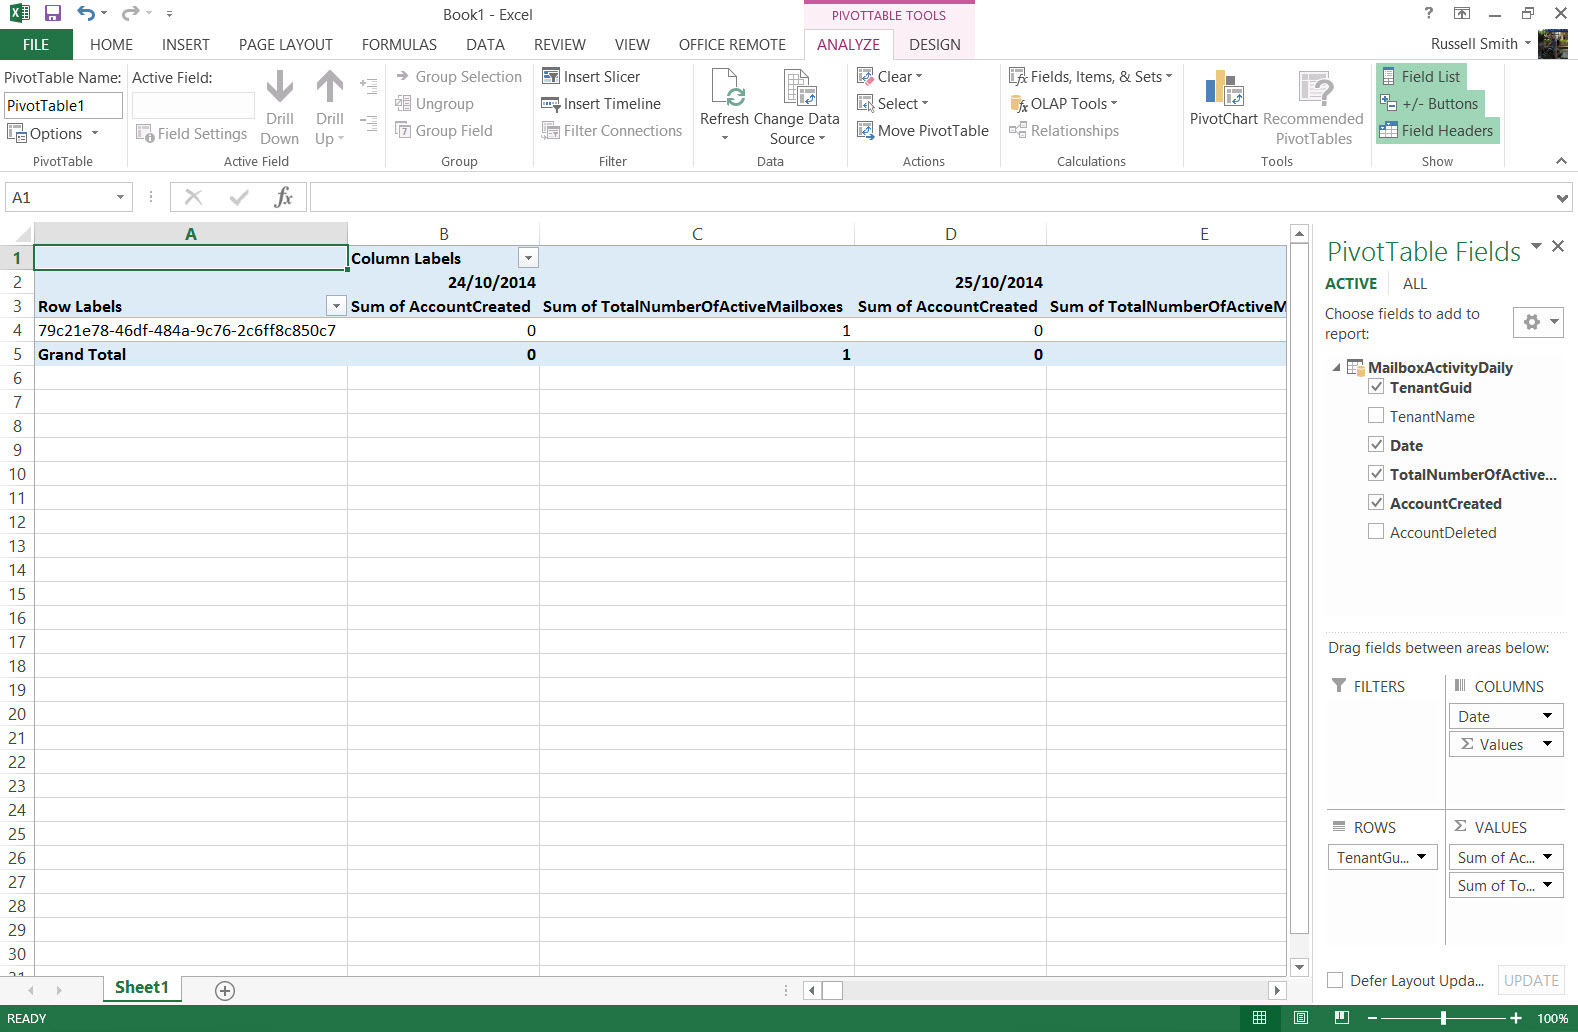
- Once the data has been imported, in the PivotTable Fields panel on the right side of Excel select the fields to display.
Now that the data has been imported into Excel, you can manipulate it as required.


