Server Performance Advisor (SPA) for Windows Server 2003
This is an article following my previous one about the PAL (Performance Analysis of Logs) tool – read “Quickly Analyze your Server’s Performance Monitor Logs ".
Microsoft Windows Server 2003 Performance Advisor v2.0 is the latest version of Server Performance Advisor, which is a simple but robust tool that helps you diagnose the root causes of performance problems in a Microsoft Windows Server 2003 deployment. It measures the performance and use of resources by your computer to report on the parts that are stressed under workload. It does so by collecting performance data and generating comprehensive diagnostic reports that give you the data to easily analyze problems and develop corrective actions.
SPA provides several specialized reports, including a System Overview (focusing on CPU usage, Memory usage, busy files, busy TCP clients, top CPU consumers) and built-in template reports for server roles such as Active Directory, Internet Information System (IIS), DNS, Terminal Services, SQL, print spooler, and others. In fact, SPA is kind of a Performance Monitor tool that is integrated with Network Monitor and has a built-in logic that allows for easier understanding of the captured data and can help you identify clients or applications that are consuming resources on a server.
What can SPA be used for?
When collecting data for a report, SPA logs activity over short periods of time (seconds or minutes, not hours). Logged events are then correlated to generate a profile of the workload, and a rule-based system analyzes the data to highlight the most important performance problems found.
Server Performance Advisor can be used to identify trouble spots and speed recovery after a failure. Another important usage of SPA is monitoring servers in early phases of deployment, in order to obtain important information about the server’s workload and the client traffic. By interpreting this information you be able to size your servers according to the historic usage patterns. Also, by examining reports of data collected on a regular basis on production servers, you will become more familiar with how your servers are used and be able to notice irregular usage patterns. This helps you react proactively in your production environment.
Server Performance Advisor uses three sources of data to evaluate performance:
- Performance counters
- Configuration settings
- Trace instrumentation
Performance counters are the same source of data used by Performance Logs and Alerts. Configuration settings are those stored in the registry to configure the relevant server components. Trace instrumentation is data from Event Tracing for Windows (ETW marks every major operation with start and stop events, which are logged to enable tracing).
Brad Rutkowski wrote about some of the nifty things in SPA in his blog (see link below):
1. It’s XML based so the reports that are collected get organized “automatically” by date and server so you can drill down on a particular server. You could have a thousand reports on your reporting server and its quite easy to navigate via IE to the server and date that you are looking for.
2. You can setup SPA on your servers in “Data” mode and then setup a member server as a SPA “reporting” server, then you can schedule your servers to collect at a certain time and send that data to the reporting server. You can also have SPA (with version 2.0) take the data from those servers and put it in a SQL database for trending purposes. This is what we do internally, we setup the jobs to run at 10 and 2 to get peak utilization trending on our domain controllers. There is a chm file with SPA with more details on this.
3. Doesn’t require a reboot to install.
4. Was deemed so awesome it is built right into Vista and Windows Server 2008 (Data Collection Sets).
Where do I download SPA and what are the requirements?
SPA v2.0 can be downloaded from this link:
Microsoft Windows Server 2003 Performance Advisor
System Requirements:
- Supported Operating Systems: Windows Server 2003. You can run Performance Advisor on x64-based versions of Windows Server 2003.
- .NET 1.1 Framework
- SQL 2000 or MSDE (if you use the data trending feature). For more information, see “Trending Data” in the Server Performance Advisor Help
You must be a member of the Administrator group on the local computer or a member of one of the following groups: NetworkService, Performance Log Users, and System.
Note: Do not install on Windows 2000 or Windows XP as neither are supported.
Note: If you already have Server Performance Advisor 1.0 installed, when you start spa_v2.msi, you must choose the Remove option. This removes Server Performance Advisor 1.0 but preserves your archived reports. When the installer finishes, restart spa_v2.msi and follow the instructions.
Note: Server Performance Advisor 2.0 supports a new management pack that passes the data it collects to Microsoft Operations Manager (MOM). See download link below.
How do I use SPA?
SPA can be run in one of two modes: GUI and Command Line.
From the GUI
In order to use the GUI mode just launch it from Start > Programs > Server Performance Advisor. The main window opens and within it you can select the type of pre-defined template to use. In my example, SPA was installed on a stand alone server therefore there’s no Active Directory option to work with, but the template is in fact installed, it’s just not active.
Select your desired template and press the Play button. Note how the progress bar is displayed on the bottom part of the window.
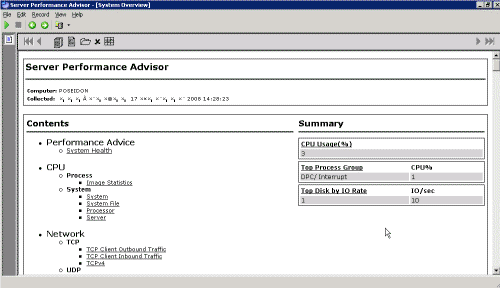
After SPA has finished capturing the data you will be able to view the report generated. You can find it under the name of the template you’ve selected.
Scrolling through the log report you will be able to find various information and interpretations of that information, such as areas where your server is experiencing bottlenecks or other not-so-optimized performance issues.
From the Command Line
In order to use the CLI version you need to run SPACMD.exe from the C:\Program Files\Server Performance Advisor folder. To run the desired analysis you will need to begin the capture of data.
If you want a system overview report you will need to run the following command:
spacmd start "system overview"
You can replace the words “system overview” with any of the valid performance tests (i.e. “active directory” and so on).
The collection process will begin and you can see a few processes called plahost running in Task Manager.
You can let this run for the default time of 300 seconds, but you can also manually stop the process by typing:
spacmd stop "system overview"
Or even better, type:
spacmd start *
To just stop all the running tasks.
Next, you need to generate the report. Under C:\PerfLogs\ you will find a few subfolders and files. Note that you’ll find a sub-folder named after the type of analysis you’ve performed. For example, running the system overview test will leave you with a folder named C:\PerfLogs\Data\System Overview\.
In the Command Prompt type:
spacmd compile "system overview"
Once the task is complete you should see the report in the reports directory. Double-click the report.xml file to view the report.
Links


