Microsoft Releases Azure Firewall Updates to Troubleshoot Network Performance Issues

Microsoft has announced some new logging and metric improvements to provide more insights into Microsoft Azure Firewall traffic. The Latency Probe metric feature enables IT admins to monitor the overall latency and health of Azure Firewall to troubleshoot app performance issues.
“In the case that Azure Firewall is experiencing latency, this can be due to various reasons, such as high CPU utilization, traffic throughput, or networking issues. As an important note, this tool is powered by Pingmesh technology, which means that the metric measures the average latency of the firewall itself. The metric does not measure end-to-end latency or the latency of individual packets,” Microsoft explained.

Previously, the firewall logs didn’t show the complete journey of the packet in the TCP handshake. Microsoft has introduced Flow Trace logs that allow IT administrators to monitor all packets traversing through the firewall. The capability makes it possible to view the return packet, failed connections, and unrecognized packets.
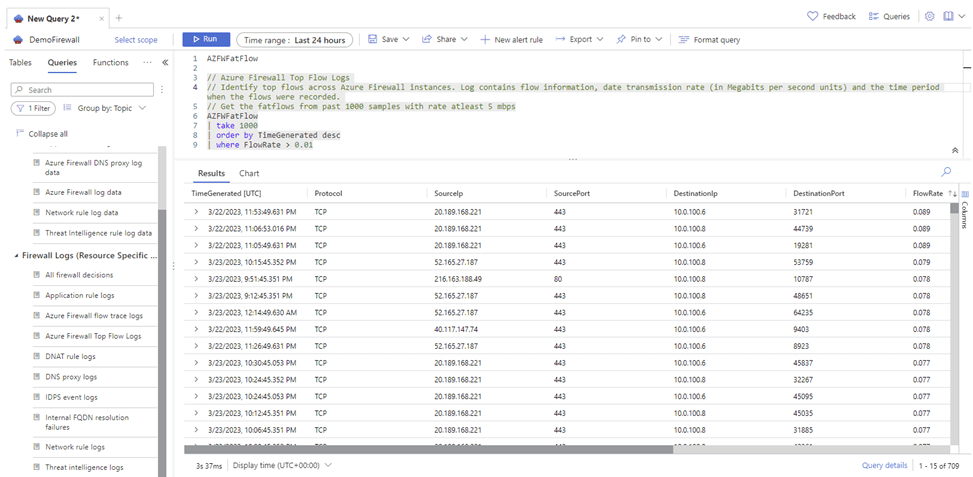
Microsoft Azure Firewall now supports Top Flow logs
The Top Flows log feature shows the top connections that are responsible for the maximum data transfer in a specific time frame through the firewall. IT admins can monitor the top traffic to detect any unexpected or anomalous traffic. The Top Flows log also helps to allow or block network traffic based on the results.
Microsoft says that the new logging and metric capabilities are available in public preview for Azure Firewall customers. You can check out this support page to learn more about configuring Flow Trace and Top Flows Logs.

Rabia has a master's degree in Software Engineering and she has years of experience writing professionally about Microsoft products and other technologies. Rabia has also written for OnMSFT.com as well as Windows Report. She is always up to date on t...