How to Monitor Network Activity Using Windows 10 Packet Monitor (PKTMON)
Packet Monitor is a command-line tool that first appeared in Windows 10 version 1809. Although you could be forgiven for not noticing as Microsoft is only beginning to speak about it now. Packet Monitor is designed to help debug network issues, specifically those where network virtualization is involved.
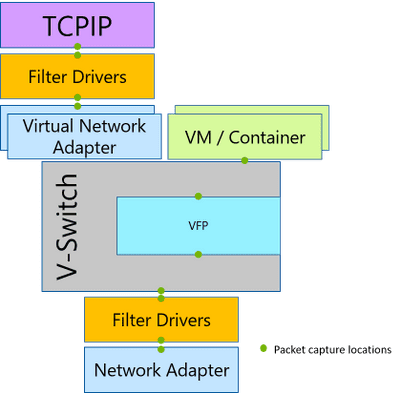
Before the advent of Software Defined Networking (SDN) and virtualization, the network stack was much simpler. It had three layers: TCP/IP, filter drivers, and a network adapter. But as you can see in the diagram below, once you add SDN and virtualization, the stack becomes more complicated.
Packet Monitor (PacketMon) can intercept packets at all the different layers of the network stack so that you can trace the packet route. In the latest version of Packet Monitor, when a packet is dropped by a supported network component in the stack, PacketMon reports it.
PacketMon also provides extra information, like why a packet was dropped. This helps IT pros determine whether a packet was dropped, where it was dropped, or if it reached its destination. PacketMon also lets you perform a high-level packet flow analysis without need to look at log data.
Create PacketMon filters and start monitoring
Before you can use PacketMon, you need to open an elevated command-line prompt. You can then add some filters and start monitoring. It isn’t compulsory to add filters, but if you don’t, PacketMon will capture literally everything.
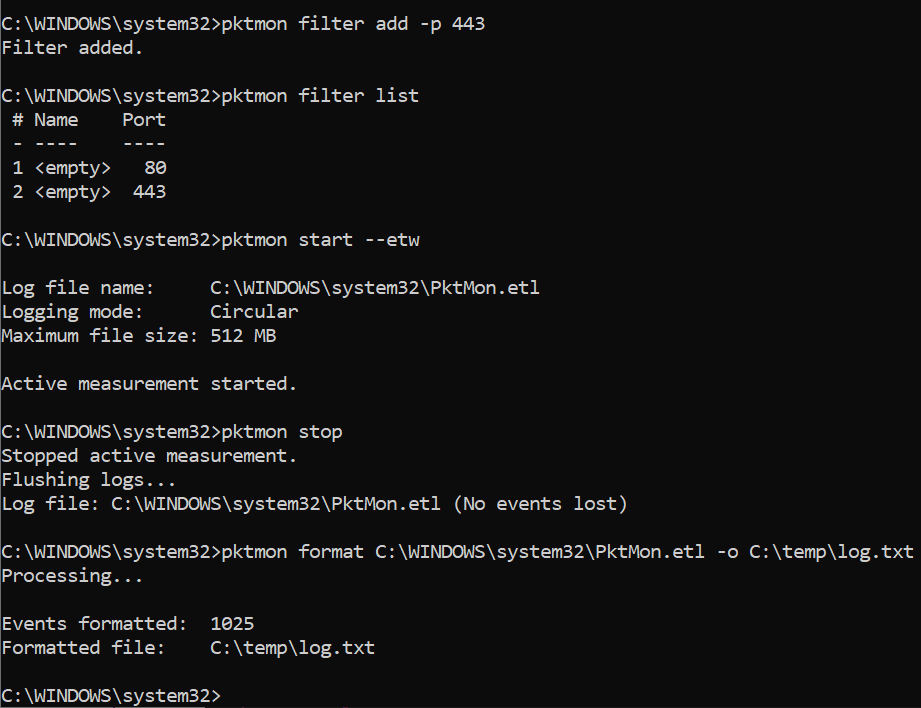
Let’s add two filters for ports 80 and 443.
pktmon filter add -p 80
pktmon filter add -p 443
Now let’s list the filters to see if they were successfully added:
pktmon filter list
To start monitoring on all network ports, and just the first 128 bytes of each packet, run:
pktmon start --etw
The resulting log (PktMon.etl) will be stored in C:\WINDOWS\system32. To stop monitoring, run:
pktmon stop
It’s not possible to read PktMon.etl directly, so you’ll need to format the file first. In the command below, we create a new formatted file (log.txt) in the c:\temp directory on the local computer:
pktmon format C:\WINDOWS\system32\PktMon.etl -o C:\temp\log.txt
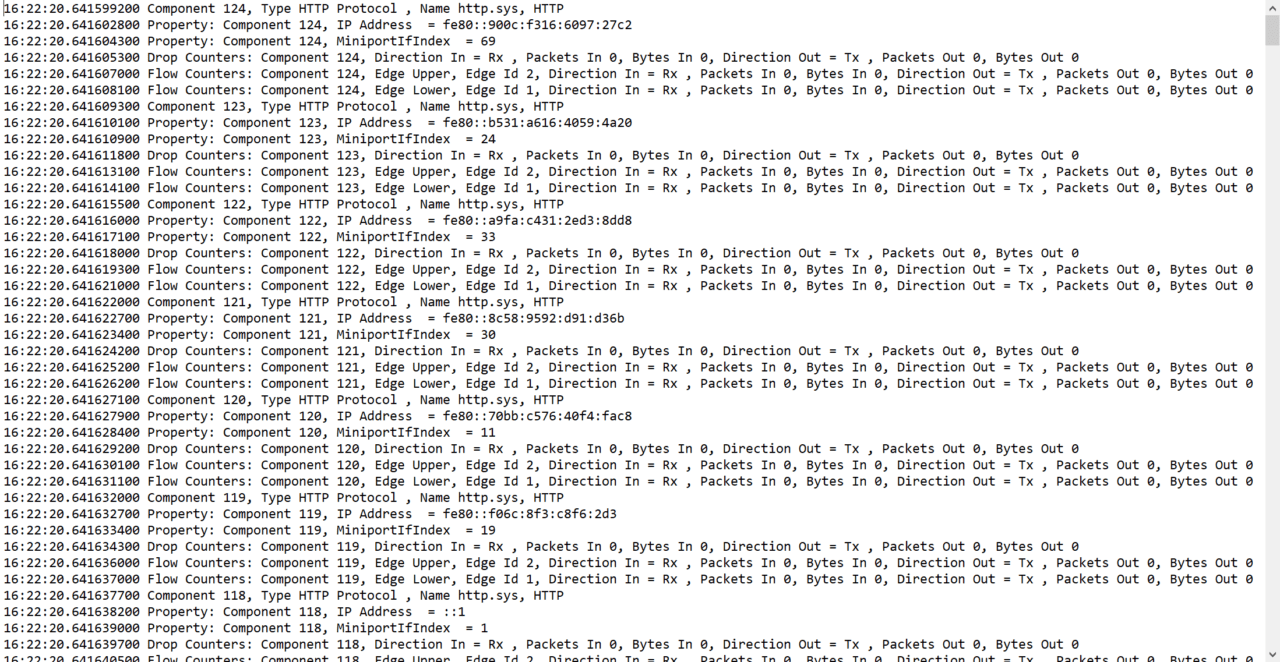
Open the log.txt file to see the data recorded by PacketMon. If you want to capture entire packets instead of just the first 128 bytes, just add -p 0 to the command:
pktmon start --etw -p 0
Packet filters can be more complex. For example, PacketMon can be set up to filter MAC addresses, IP addresses, ports, EtherType, transport protocol, and VLAN Id. The command below sets up a filter to capture all SYN packets sent or received by the IP address 10.0.0.1.
pktmon filter add -i 10.0.0.1 -t tcp syn
Real time monitoring and converting ETL logs to Wireshark (PCAPNG) Format
Providing that you are using at least Windows 10 version 2004, you can enable real time packet monitoring in the command line window and convert the ETL logs to PCAPNG format, which is used by the popular Wireshark network monitor. ETL logs can be read by Microsoft’s Network Monitor, but the software is deprecated.
Related article: Test Network Connectivity with PowerShell Test-Connection
To enable real time monitoring, just add the -l parameter as shown below:
pktmon start --etw -p 0 -l real-time
To convert your ETL logs to PCAPNG format,
pktmon pcapng C:\WINDOWS\system32\PktMon.etl -o C:\temp\log.pcapng
Unload the PacketMon driver
And don’t forget when you are done with PacketMon, to unload the driver:
pktmon unload
PacketMon is slowly evolving
PacketMon isn’t a replacement for tools like Wireshark. But while PacketMon has limited capabilities, there’s enough here to help start debugging network issues, regardless of whether SDN or virtualization is involved. And unlike some other tools, you don’t need to set up two nodes on your network to work with PacketMon. It’s also nice to see the tool slowly evolve as Microsoft fleshes out its capabilities.


