How to Configure SharePoint 2013 ULS Logging Levels
- Blog
- SharePoint
- Post
Troubleshooting SharePoint 2013 can be frustrating and tedious, but one of the really great things that SharePoint does is provide fine-grained logging capabilities. SharePoint logs a lot of what happens in the Windows event logs. But in addition to the Windows Event Logs, SharePoint has its own logs that it uses for reporting: the Unified Logging System logs (ULS). Today I’ll introduce you to ULS logs in SharePoint 2013, and I’ll show you how to configure them.
Universal Logging System (ULS) Logs in SharePoint 2013: Overview
ULS logs are there to capture events from a wide variety of sources. These log files exist on every server in the SharePoint farm and write events constantly as they happen in your SharePoint environment.
Where are the ULS logs stored?
The ULS logfiles are stored in the “SharePoint 15 hive.” This location is set during the installation of SharePoint. By default, the location is:
C:\Program Files\Common Files\Microsoft Shared\Web Server Extensions\15\Logs
What kind of data is captured in the ULS logs?
The ULS Log files capture only the events that happen on that server. So you won’t find events from the search service being reported on a SharePoint server that isn’t part of your search topology. However, there are a lot of different sources of events that you’ll see on each of your servers. Events about service applications, web applications, and errors across all components and features of SharePoint.
How are the Universal Logging System Logs related to the logging database?
One of the services that you can run in your SharePoint environment is the Usage and Health Monitoring Service. One of the components of that service is the Logging database, named by default as WSS_Logging. Through the work of two different timer jobs that run in your SharePoint farm, the ULS logs from the individual servers are cataloged in the WSS_Logging database. This creates another repository of logging data from your SharePoint farm.
So while the ULS log files are held on the servers, they are also saved into the WSS_Logging database. Now, if you don’t need as much of your ULS logs moved over into your WSS_Logging database as you currently have, you can easily (via PowerShell) reduce the size of that WSS_Logging database by changing which log sources are saved to it.
How are the ULS logs read?
There are some great options to help you make the most out of it. For starters, you can use the PowerShell cmdlets to merge logs and view event logs. You also have the developer dashboard, the ULSViewer, and the ability to customize just how much information you want SharePoint to report in the Windows Event Logs and the SharePoint logs.
In this article I’m going to show you how to make SharePoint save just the right amount of data into the logs. Are your SharePoint logs filling up too fast, or are you missing the information that will help identify the problem in a service application? Both of those situations can be made a lot better with just a few simple actions.
Saving Information into ULS Logs
You can save disk space by reducing the amount of data you’re saving to log files, and you can also make troubleshooting easier if you are not logging as much information. Of course, it doesn’t help to turn off the logging so much that items you want to know about are being filtered, so use your best judgment to come up with just the right balance.
Each server keeps its own logs for the items that happen on that server. However, the sources all stay the same and you set the logging level for the sources at the farm level.
Event Sources in SharePoint 2013 ULS Logs
The events that can be logged in SharePoint 2013 come from a wide range of sources. Each service application is a source, like Search and Access Services. Each of the service applications can further be broken down into their subcategories if you like.
Additionally, there are several built-in categories that are not a part of any one service application, but instead are a built-in feature or subset of features, such as SharePoint Foundation and Web Content Management.
Event Logging Levels in SharePoint 2013
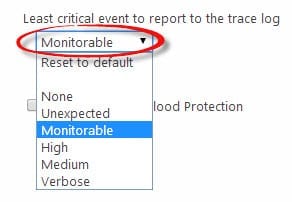
You can choose to limit the writing of the event logs based on the severity of the event. There are two destinations that you can specify. First, you can set the level of events that are written to the Windows Event Logs. Second, you can set the level of events that are written to the ULS logs. Though the names are different, they mean the same thing.
Critical = Unexpected
Error = Monitorable
Warning = High
Information = Medium
Verbose = Verbose
You can also specify to enable flood protection, which means that if the same event keeps happening, it won’t keep writing the same event to the log over and over again. Instead, an entry will be made indicating that the event won’t be further logged but that it is recurring.
Adjust ULS Log Settings in Central Administration
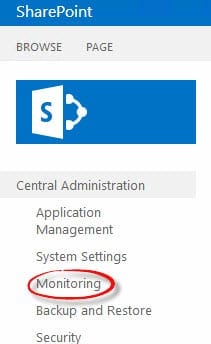
- To begin, open Central Administration, then open Monitoring.
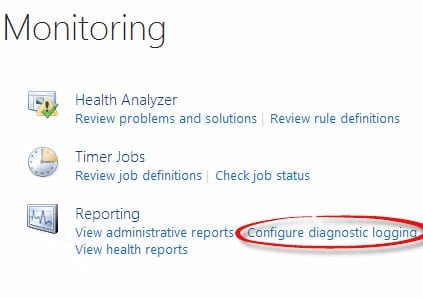
- On the Monitoring section of Central Administration, select Configure Diagnostic Logging under the Reporting section.
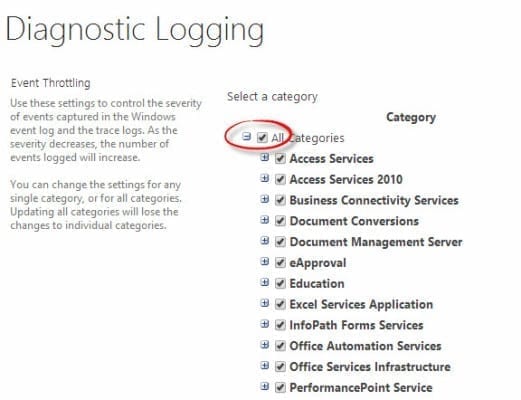
- At the Diagnostic Logging screen, you can select any of the categories you wish to adjust by expanding out the branches of the structure and putting a check in the boxes you want to change. To select all, put a check in the top box.
- Modify the settings for the selected items by using the drop-down menus for Least critical level to report to the trace log.
- After you’ve made your choices for the log levels, click OK.
Adjust ULS Log Settings with PowerShell
In PowerShell, you’ll have the same options but you’ll do it all from the PowerShell console.
Start the SharePoint Management Console. A simple way to work with the log levels is to load them into a variable first.
$LogLevels = Get-SPLogLevel
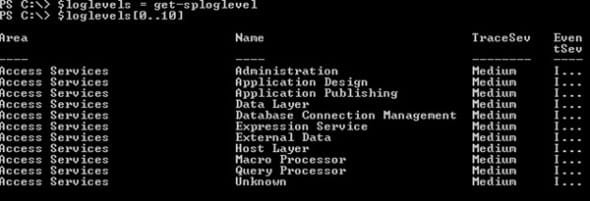
Now you can see that the first few entries in the log levels variable match up with the top of the list that we saw in Central Administration.
$LogLevels[0..10]
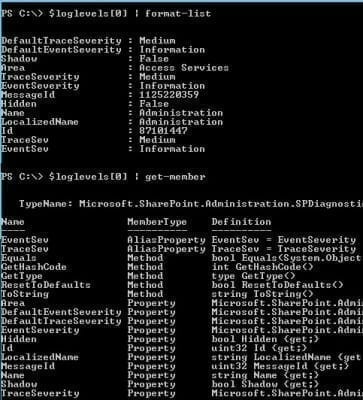
With the formatting scrunched up, it’s hard to see what is going on in the last two columns. Also, we don’t know what other properties are there but aren’t being shown. We can see more properties in a list format, so we can pipe one of the log levels into the Format-List cmdlet to see what’s going on.
$LogLevels[0] | Format-List
Now we can see that there are two properties – TraceSeverity and EventSeverity – that match up well with the severity levels to send to the event logs and the trace (ULS) logs. But there are also the TraceSev and EventSev. To get a better idea of what those properties are, you can pipe them into the Get-Member cmdlet.
$LogLevels[0] | Get-Member
Note that when using Get-Member we can see that TraceSev and EventSev are alias properties, so it’s just a shortcut for us. We can use TraceSev or TraceSeverity and they both are exactly the same thing, just two ways to get there.
Now we can apply a filter to our list of log levels using the Where-Object cmdlet. This filter can be applied based on any of the properties of the log levels. For simplicity, I’ll do “All log levels from the Access Services source.”
$AccessServices = $LogLevels | Where-Object {$_.Area –match “Access Services”}
And finally we can pipe the contents of our new variable into the Set-SPLogLevels cmdlet.
$AccessServices | Set-SPLogLevel –TraceSeverity “Monitorable”
Nothing To It, Right?
Working with the log levels can be a delicate balance. You don’t want to log too much data because you want to minimize the bloat of the log files as much as possible. On the other hand, you don’t want to miss that valuable piece of information.
But now you know just how easy it is to adjust those settings to get just the right level of detail in your ULS logs, and how to adjust them quickly in case you know you need more or less detail.


