Network traffic in virtual desktops (VDI) is often given little thought or forgotten altogether. There are many reasons why you would want to monitor network traffic. Some common reasons are for troubleshooting an existing environment or for planning a new one. In this post I will walkthrough some basic methods for monitoring PCoIP traffic in a VMware Horizon View (formerly VMware View) desktop.
VMware Horizon View and Perfmon
Since the release of VMware View 5, VMware has included additional WMI counters that get installed when the View agent is loaded in your desktop images. These counters are used for monitoring PCoIP session statistics. The easiest way to monitor these is to run Perfmon in a desktop. This works great and it’s free, so if you do not have a tool that can monitor WMI counters remotely this will get the job done.
Monitor VMware Horizon View Network Statistics
- Open Perfmon in a VMware Horizon View desktop session in which you want to monitor the network stats.
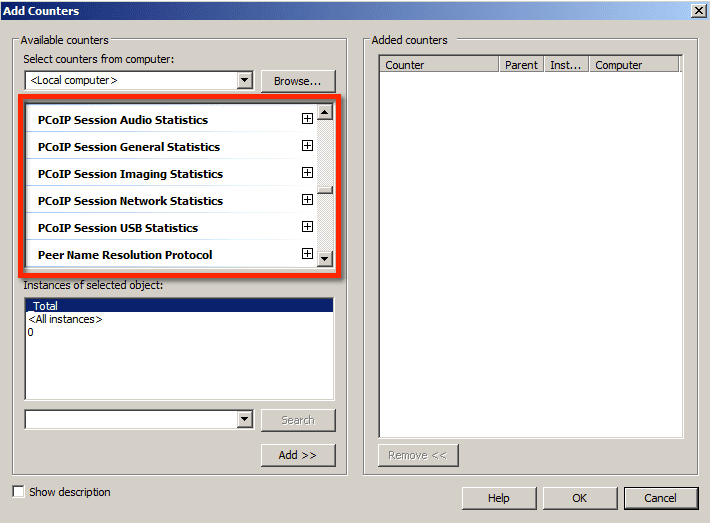
- Once in Perfmon, choose the add counters option and scroll down and look for the PCoIP counters. You can see from the image below that there are a number of counters with several ones within each item.
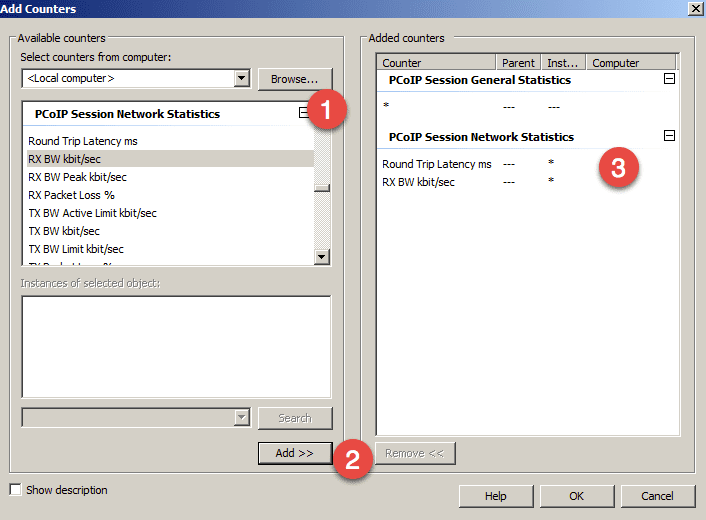
- Once you have located all the counters, expand each topic to find the counters that you want to select. For this post I will be using the PCoIP session network statistics items.
- Once expanded, select the counters that I want and click the Add button. They should show up on the right-hand side. Click OK to proceed.
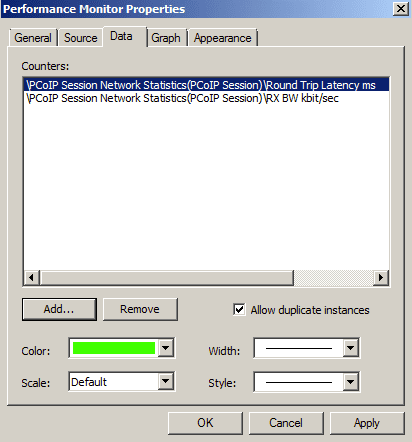
- The counters that were selected should now be listed in the properties window of the Perfmon graph for the current session. A sample is shown below. Remove any unwanted counters and click on OK.
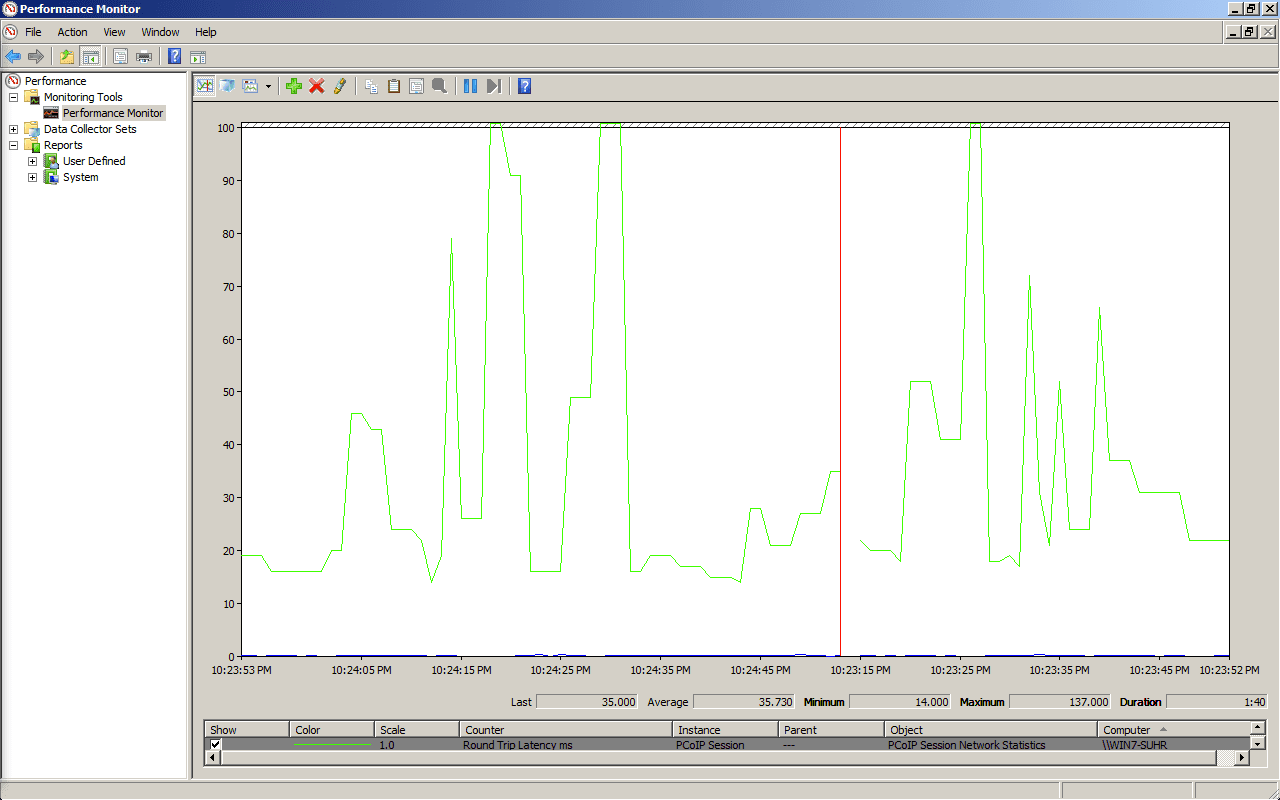
You should now be looking at the Permon graph and it will be displaying the counters that we selected earlier. In this sample I wanted to monitor session latency and session bandwidth, which are both important. These numbers will help me estimate what my session performance will be and also how much network bandwidth each session will use.
I can then take these numbers and estimate what our total network performance might be with some larger number of users connecting from the same locations.
This is a manual way to gather the details, but for those who don’t have fancy tools, it’ll help them get the job done. Note: You will want to capture these details from a variety of desktops to capture a sample of the different types of users in your environment.


