Enable Diagnostic Logging in Windows Server 2012 R2 Routing and Remote Access
In today’s Ask the Admin, I’ll show you how to enable verbose logging in Windows Server 2012 R2 Routing and Remote Access (RRAS).
I’ve recently been using Windows Server’s Routing and Remote Access service to establish a VPN connection between an Azure virtual network and a physical site. And while the set up process is relatively easy, debugging can be a headache when things go wrong, as Windows isn’t known for its useful log information. Detail log tracing can also be enabled for Azure VPN gateways. For details, see Troubleshooting Azure VPNs on the Petri IT Knowledgebase.
The first step I needed to take was enable diagnostic logging in RRAS because the Event Log by default only contains a basic set of events that don’t shed much light when there are connection issues. Don’t forget that once you’ve resolved your connection problems, you’ll want to disable diagnostic logging due to the extra overhead it creates.
Enable RRAS logging
Log in to Windows Server 2012 R2 as an administrator and follow the instructions below. The Routing and Remote Access server role must already be installed.
- Open Server Manager using the tile on the Start screen.
- Click Tools in the top right corner of Server Manager, select Routing and Remote Access from the drop-down menu.
- The Routing and Remote Access MMC will connect to the RRAS service running on the local server. Right click the local RRAS server in the top left of the Routing and Remote Access MMC and select Properties from the context menu.
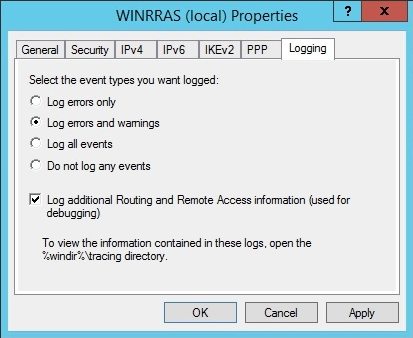
- In the Properties dialog, switch to the Logging tab.
- On the Logging tab, check Log additional Routing and Remote Access information (used for debugging).
- Click OK in the Properties dialog.

If you are debugging a VPN or other interface, you might want to now manually start it by right clicking the interface name and selecting Connect from the context menu. To see the list of interfaces, click Network Interfaces on the left of the Routing and Remote Access MMC.
Locating the logs
Diagnostic logging writes data to various different files, which you can find in the %windir%/tracing folder. Check for log data in the PPP.log, RASMAN.log, IASHLPR.log, RASAPI32.log, and RASIPCP.log files. Don’t forget that there might also be some useful information in Event Viewer, which can be accessed from the Tools menu in Server Manager. By default, RRAS logs errors and warnings only, but you can change this to Log all events in the same place that we enabled diagnostic logging.


