Monitoring Your Database with SQL Profiler
- Blog
- SQL Server
- Post
SQL Server Profiler is a flexible profiling tool that comes with SQL Server. Profiler allows you to monitor and capture a record of the activity going on in your database, including ad hoc queries, stored procedure requests, logins, errors, and much more. Today we will walk through an example of one way to use Profiler as we introduce the tool.
Important: When you run Profiler, it puts added strain on your server and network. We advise against running SQL Profiler against your production databases for any length of time during operating hours. If you absolutely need production trace data, please see the Further Reading section below for information on server side traces.
Let’s say that we have an application named SOCK that runs against our database SOCKsql, on the SwampTest server. We’d like to see what T-SQL queries hit the database when a user logs into SOCK. We’ll need to:
- Start SQL Server Profiler and set up the trace
- Run the trace while we perform the SOCK application login
- Stop the trace and examine the captured data
Start SQL Server Profiler
You can start SQL Profiler from the Start menu, or from within SQL Server Management Studio (SSMS) under the Tools menu. (You can also use Start > Run > Profiler.) On startup, Profiler will present you with a Connect to Server dialog box; enter the name of the server you wish to trace – and your authentication details – just as you would for SSMS, and click Connect.
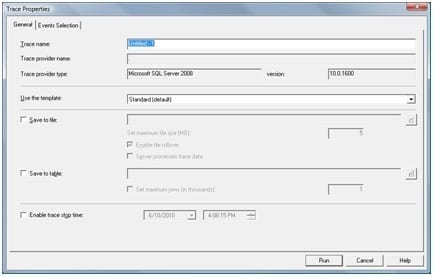
The Trace Properties window allows you to tailor the trace to your needs. On the General tab, you can enter a Trace name, choose a trace template, select save options, and enable a trace stop time. Today we’re only running a short trace that we don’t intend to save, so we’ll keep the default options.
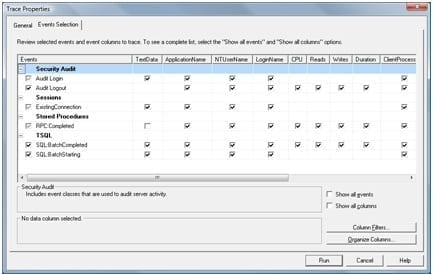
On the Event Selection tab we choose what database events, and which attributes from each event we would like to capture. The events that are already selected are part of the “Standard” template that we saw on the General tab. (Note that checking and unchecking boxes on this screen will not affect the template.)
Near the bottom right of the screen, there are two checkboxes. “Show all events” displays all the possible events we can trace using Profiler. Take a quick look at all the categories available, then uncheck the box.
Check the box marked “Show all columns” so we can see all the available attributes for each event.
- We don’t really need the Audit Login and Audit Logout events today, so uncheck them.
- You will need the “ExistingConnection” event 99% of the time; without it, any action performed by an existing connection will not show up in your trace.
- RPC: Completed stands for “Remote Procedure Call: Completed”. The SOCK application most likely makes use of RPCs, so we will leave that checked. Additionally, scroll right and select “Database” for the RPC:Completed event. We’ll see more about this later.
- SQL:BatchStarting and SQL:BatchCompleted denote the beginning and end of a group of T-SQL statements running against the server. These can come in handy for delving into specifics, but again, we’re really only interested in the procedure calls today. Uncheck these.
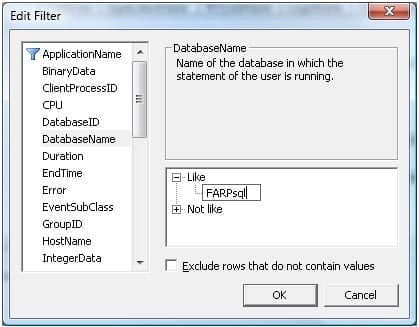
Let’s also use column filters to filter out trace data that doesn’t apply to our needs. Click Column Filters, and in the Edit Filter dialogue we select DatabaseName, then click on “Like” and enter the name of our database: SOCKsql. This assures that Profiler will only capture events that are happening to the SOCKsql database.
Run the Trace
We were very selective with the events we chose on the last screen, and we’d also like to limit the time that the trace runs, so that we’re not overwhelmed with information we don’t need, and the burden on the server is lighter than a heavy trace would be.
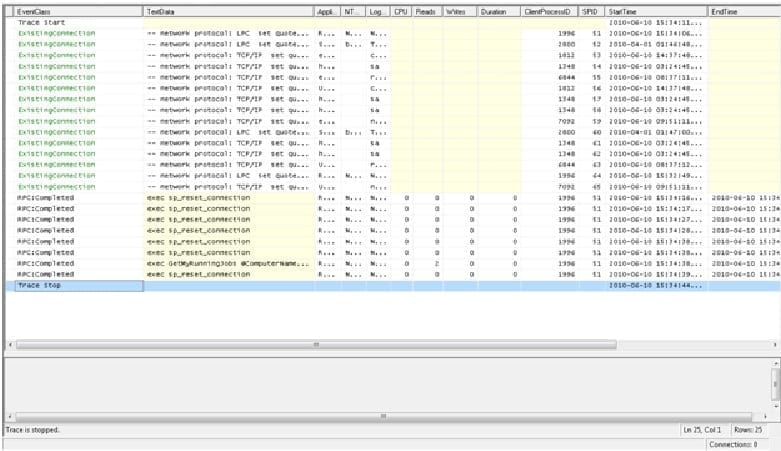
When we’re ready to log into SOCK, then we click the Run button in SQL Profiler. We can see “Trace Start” at the top of the event list in Profiler, followed by a series of “ExistingConnection” rows.
We only want to capture the events around the SOCK login, so as soon as the trace begins, we log in to the SOCK application, and then click the red “stop trace” button in SQL Profiler. We now have a table of traced events.
Read the Trace
If we wished, we could save these events into a file using File > Save As > Trace File, or as a SQL table (File > Save As > Trace Table). We particularly like saving trace data to a SQL table, as it allows us to search for specific text quickly (using SELECT * FROM tableName WHERE textdata LIKE ‘%text%’), or get the top 10 most expensive queries in terms of reads (using SELECT top 10 * FROM tableName ORDER BY Reads DESC). But again, today, we only need to see what stored procedures are being called.
You can now scroll through the traced events, or search for a keyword or number in any column. As you click on each row, the TextData for that row displays in the viewing pane at the bottom of Profiler. And remember that we filtered the data by database name; you can verify that for yourself by scrolling right to see the Database Name column.
This brief introduction to SQL Profiler should get you going well enough to start tracing database activity in your environment.
References:


