Creating Custom Reports for Configuration Manager (SCCM)
After you have completed your deployment of System Center Configuration Manager (SCCM), one of the simplest features to enable is that of the reporting server. In the latest versions of Configuration Manager 2012, this feature not only offers over 450 pre-created reports, but (far more importantly) it also provides a platform for creating your own custom reports – a feature that is overlooked in fear of the complexity that might be involved.
In this post, we will run through a quick demo of just how easy this really is to get working on your very own reports.
Create Custom Reports with SCCM: SQL Report Builder
There are many different methods of creating reports, including the more sophisticated tools that Jennifer McCown introduced in her Introduction to SQL Reporting Services. However, for the sake and beauty of simplicity, I will introduce the SQL Report Builder, quickly show you how to install this tool, and more importantly point it to your Configuration Manager Reporting Server.
- Start, by downloading the SQL 2012 report builder from the Microsoft download site.
- Launch the downloaded file to begin the installation wizard for Report Builder 3.0 (current at time of writing).
- The installation wizard will then present its Welcome screen. Just click Next to proceed.
- Review and agree to the license. Click Next to move on.
- There is only the one feature to be installed, which is of course the Report Builder. Simply click Next again.
-
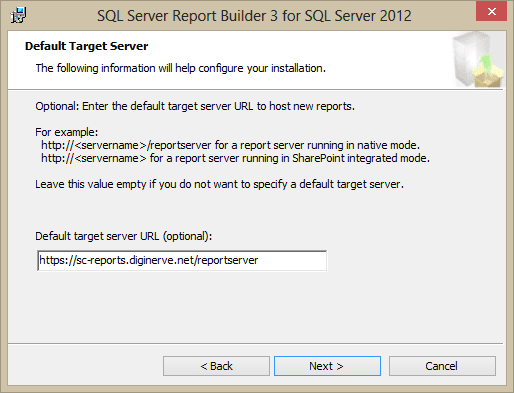
Now, on the Default Target Server you are offered the option to provide the URL of your Configuration Manager Report Server. Click Next.
- If you don’t know what the URL is, open your Configuration Manager console, change to the Monitoring view, and select the Reporting node in the tree. On the main page body, you will be presented with two sections, Navigation Index and Links. In the Links section you will see the URL required listed under the heading Report Server.
- Finally, click on Install.
- After a few moments, the application is installed, and you can click Finish to terminate the wizard.
Creating a Report
With the report builder now installed, launch the application. A dialog will popup presenting a progress bar while trying to connect to your report server. Ensure that you are logged in as a user with permissions to use and contribute to the report server, otherwise you will be presented with a “connection failed” message after a few moments. With a successful connection, the Getting Started page will be presented, offering you multiple options.
For this quick demonstration, we will begin with a new Blank Report, which will drop directly back into the report builder interface.
Step 1: Data Source
First we will create a connection for our new blank report with the data source we wish to use. For us this is simply going to be SCCM, and it will be even easier as the previously installed 450+ reports are all designed to use a single data source also, which of course is the SCCM databases!
To establish a connection for our report to the SCCM database, we just select the Data Source node in the Report Data tree, which by default is presented on the left pane of the window, and from the context menu choose the option Add Data Source.
- A Data Source Properties dialog is then presented. We have the option to create a new connection, which is similar to creating an ODBC connection, or we can use a previously created connection. I am going to work with the latter, as SCCM has already created a connection for use by all its reports which is just perfect for our needs.
- Select the option Use a shared connection or report model.
-
Click on the Browse… button, which will display another new dialog, Select Data Source.
- In this dialog we will select the URL of our Report Server (this is the same URL we provided during installation).
- Like Explorer, the window will update to present the folders which are created on the report server, by default you will only see the name of your Configuration Manager Reports folder, and it normally has the format of ConfigMgr_XXX. Double-click on this folder to navigate forward.
- Now, you will be presented with a long list of folders, grouping all the different report categories offered in SCCM. Scroll to the very end of this list.
- A Database Connection should finally be offered. This will likely not have a normal name, but instead a GUID; select this connection and then click Open.
- Back in the Data Source Properties dialog, you will now see the connection presented in the view ready for our use. Click OK to complete this step. The new Data Source will be added to the Data Source node on the Report Data tree.
Step 2: Data Set
With a connection now established to our SCCM database, leveraging the same connection used by the Microsoft provided reports, we next need to create a query for the data which we will use for the content of our report. The results of this query is referred to as the Data Set, or simply the set of data which will be used in the final report, at the time of execution.
These queries can range from the very simple to brain surgeon-level complex. If you are good with SQL queries this this will be a breeze; otherwise, use the community as there are literally thousands of great example queries posted all over the Internet.
To demonstrate I am going to use a moderately complex query which was posted by Shitanshu, a Microsoft SCCM guru. This query will calculate the Total Number of Clients on an SCCM Sites, organized by Active, Inactive and Obsolete, and calculating these is a % of the total. The SQL syntax is as follows:
select sub.AssignedSite,
sum(sub.cnt ) 'Total Count',
SUM(CASE SUB.ACTIVE0 when 1 then SUB.cnt END) AS 'Total Active Clients',
SUM(CASE SUB.ACTIVE0 when 0 then SUB.cnt END) AS 'Total Inactive Clients',
SUM(CASE SUB.obsolete0 when 1 then SUB.cnt END) AS 'Total Obsolete Clients'
,ROUND((CAST(SUM(CASE SUB.ACTIVE0 when 0 then SUB.cnt END) AS float) / SUM(sub.Cnt)) * 100,2) AS '% of Inactive Client Count'
,ROUND((CAST(SUM(CASE SUB.obsolete0 when 1 then SUB.cnt END) AS float) / SUM(sub.Cnt)) * 100,2) AS '% of Obsolete Client Count'
FROM
(select sit.sms_assigned_sites0 AssignedSite,
sys.active0,sys.obsolete0 ,
COUNT(*) cnt
from v_R_System sys
join v_RA_System_SMSAssignedSites sit on sys.resourceID=sit.resourceID
and (sys.Active0 is not null and sys.Obsolete0 is not null)
group by sit.sms_assigned_sites0,sys.active0,sys.obsolete0
)sub
group by sub.AssignedSite
To create the data set from this query, select the Dataset node in the Report Data tree, and from the context menu choose the option Add Dataset.
- A Dataset Properties dialog is then presented, select the option Use a dataset embedded in my report.
- Now, in the Data Source drop-down, select the source you created in step 1. By default this will be called DataSource1.
- Now, paste in the above query in the Query field, or feel free to create your own.
-
Click on Refresh Fields. A new dialog will be presented, requesting authentication password for the data source. This is to allow the Query Designer connect to the Data Source (our SCCM database), and run the query we just pasted.
- After providing valid credentials, the Fields tab will be update with the name of each field of data that will be contained in our dataset for the report.
- Click OK to create the dataset.
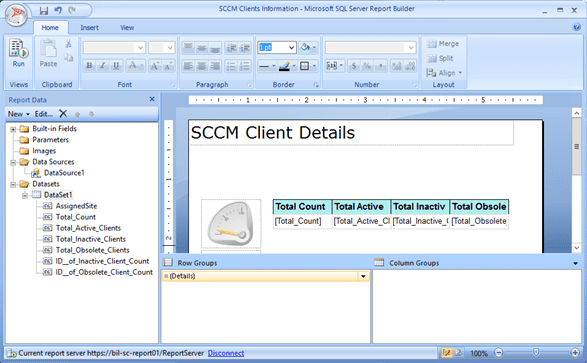
The new Dataset will be added to the Dataset node on the Report Data tree, expanded so that you can also see the names of each field which is included in the set.
Step 3: Create the Report
Both the Source and Query are complete, we can finally proceed to creating our report. There are many options available to use at this point, ranging from a simple table style report to using indicators, gauges, charts, or even multiple tests. This is really where your creativity begins. For the purpose of this example, I will just show you how to create a simple table, but I urge you to get creative and try out all the different combinations you can imagine.
- On the design canvas, or main pane of the builder, locate any of the blank space and right-click to present the context menu.
- Select the Insert, and then Table from the menu.
-
With the blank table frame now on your report page, select the first blank Data pane. In the upper right corner of the cell, a small data item icon will appear. Click this icon to get a list of fields which were exposed from your dataset.
-
Select one of the fields (for example, Total_Count). The Header row will now update with the Title “Total Count,” and the Data row will contain our Dataset Item.
- Repeat this sequence for each additional field you wish to include.
- Once you have all the data you want included, feel free to customize the look and feel of your report.
There you have it, your first report data all ready for the world to consume. As you can see the exercise itself is pretty simple, with the hardest part really getting the dataset query created.
Step 4: Publish
There is no point in working through all the previous steps if you don’t save your new report to the report server ready for consumption, so let’s wrap up this exercise with the final steps needed to publish your work.
- In the Title bar, click the Save icon to open the Save As Report dialog.
- Using the file explorer, navigate to the folder on the report server where you wish to save your new report.
- In the Name field, provide a name for the report file which will end with the extension .RDL, then click Save.
- That’s all!
Finally, all that is left is to test your new report. Launch your web browser, surf to the URL of your report server, and browse to the location you just saved your report. Then click on the report name to launch it and enjoy your work!
Report creation is not as daunting as you might expect – the tools are rather easy to manage, and the hardest part is really the query. But you can, of course, take advantage of the many query building tools available to help with this process, or leverage as I did in this exercise the work of some great community contributors. In any case, I have just opened the door – please leave back some links and comments on the work you create, and add to community!


