


Azure Automation DSC Reporting

In today’s Ask the Admin, I’ll show you how to access and work with Azure Automation DSC reports.
One of the great things about Azure Automation DSC is not only does it democratize PowerShell DSC and make DSC easier to implement, but it also makes the collection of information about the compliance state of your servers simple, either using the management portal or PowerShell. Unlike PowerShell DSC, which requires you to set up an infrastructure, including a pull server, Azure Automation DSC puts all the pieces into place without you having to configure servers or keep them running 24/7.
For more information on Azure Automation DSC, see Introduction to Azure Automation Desired State Configuration and Getting Started with Azure Automation Desired State Configuration on the Petri IT Knowledgebase.
Reports in the Azure Management Portal
Let’s start by accessing DSC node reports in the Azure management portal.
- Log in to the Azure management portal here.
- In the list of options on the left of the management portal, click More services > at the bottom.
- In the Filter box at the top of the menu, type auto and then click Automation Accounts in the results.
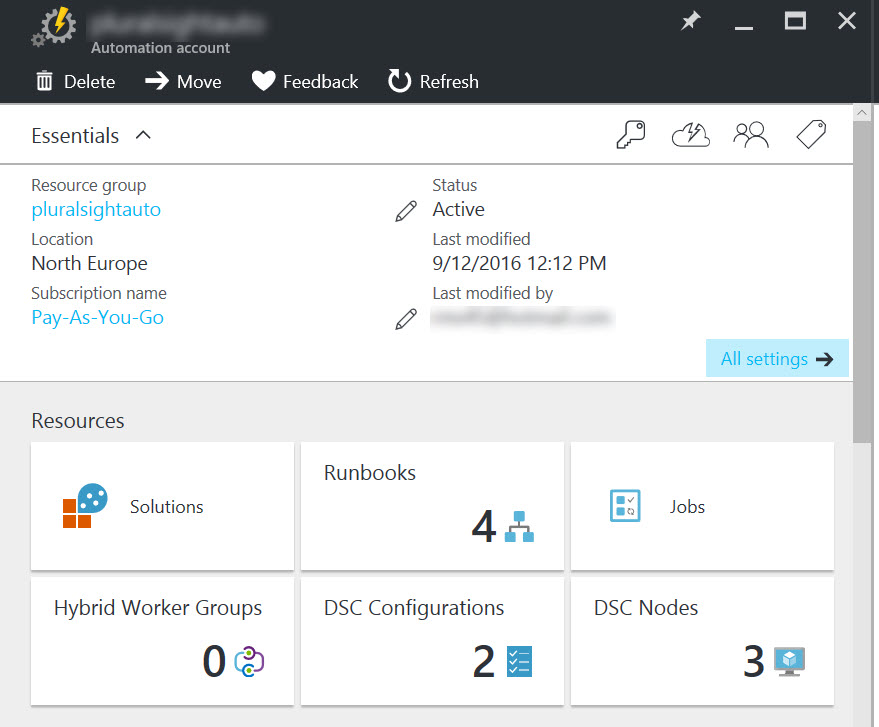
- In the Automation Accounts pane, click your automation account in the list.
- In the Automation Account pane, click the DSC Nodes tile under Resources.
- In the DSC Nodes pane, click the node for which you want to view reports.
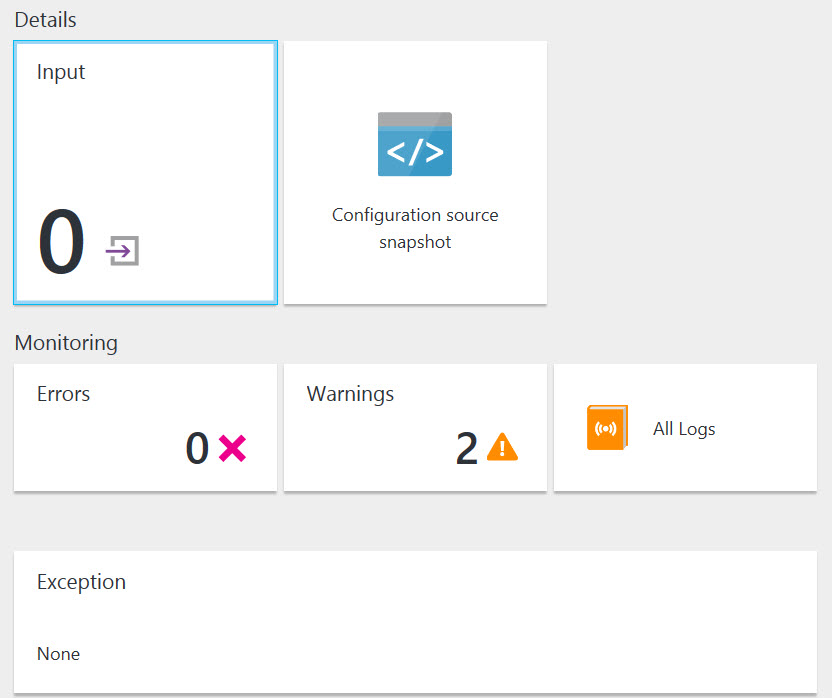
In the node’s pane, under Reports, you’ll see a list of available reports for the node. Click on a report to view it.
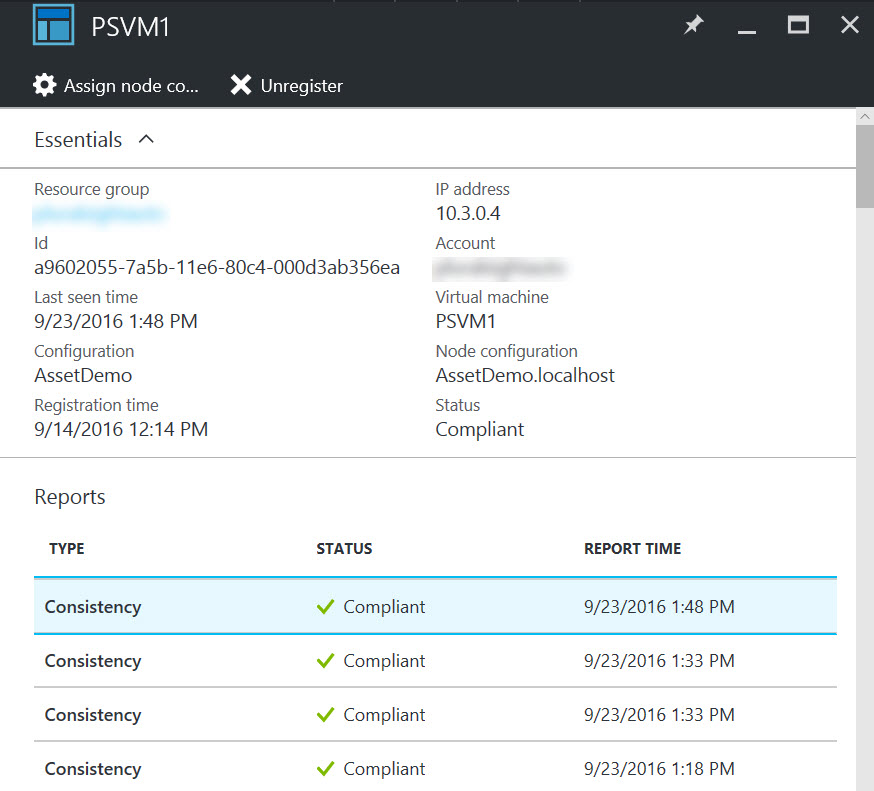
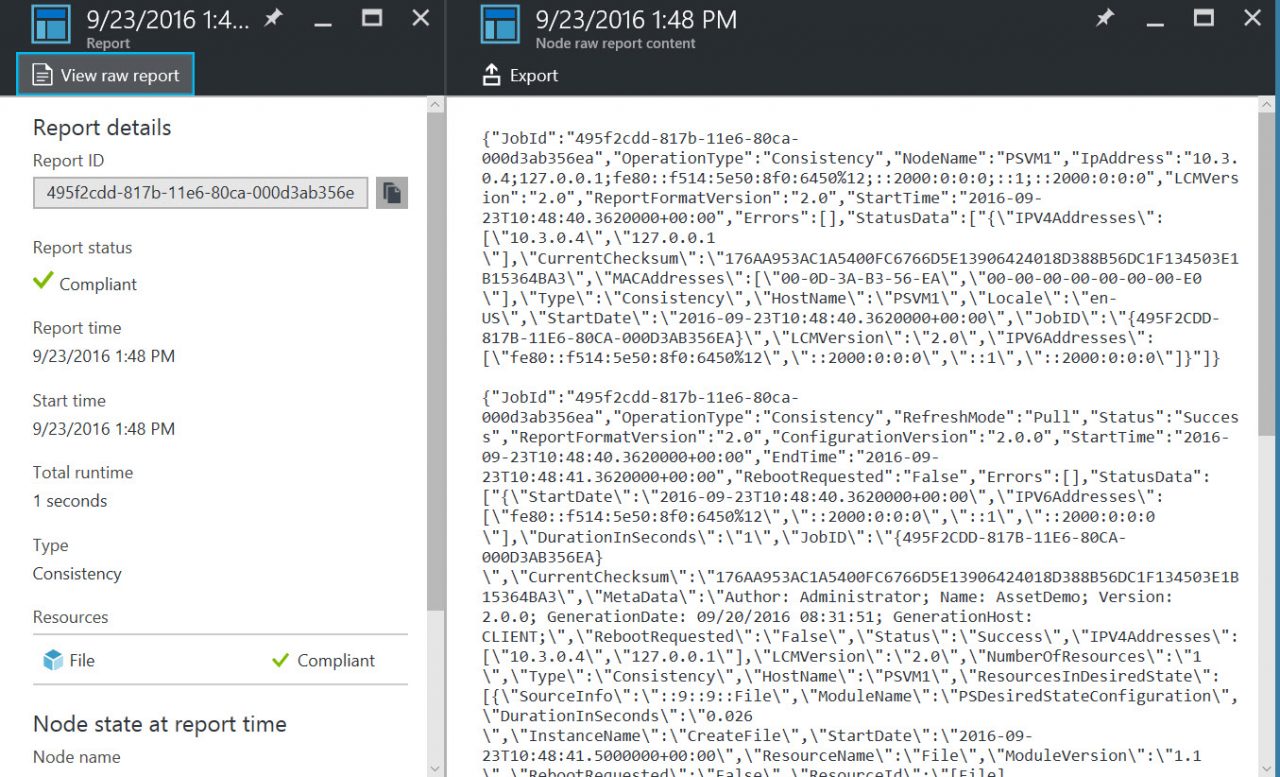
- In the report pane, view the information. If you want to see more detailed information captured in the report, click View raw report at the top of the pane.
- The raw report data can be exported as a plain text file by clicking Export.
It’s also possible to get limited information about the resource applied to the node.
- In the report pane, click a resource from the list under Resources. There might be more than one.
- In the Resource pane, click an action to see more detailed information. Again, there might be more than one.
DSC Configuration Reports
The management portal also provides information about DSC configurations.
- Close any panes you have open and go back to the Automation Account pane.
- In the Automation Account pane, click the DSC Configurations tile under Resources.
- In the DSC Configurations pane, click a resource.
A pane for the resource will open, where you can see a list of compilation jobs that ran to deploy the configuration to the pull server in the Deployments to Pull Server box. Click on a job to see more details about the deployment. Click on any of the available titles to get more information.
In this article, I showed you how to access DSC node reports in Azure Automation DSC using the management portal. It’s also worth noting that Azure has an activity log that can be accessed from the automation account’s Settings pane, where you can perform queries to get detailed log information about Azure operations.