With 2014 fresh on the calendar, you may look back and wonder if VMware vSphere 5.5 will be the last version of the classic thick vSphere client – for some time now, VMware has been warning us that the vSphere Web Client is the future and the old thick client will be retired in some upcoming version. We still have both versions in the current vSphere 5.5 version and must use them both. Since only new features are released in the web client, but a few old features like SRM or VUM require the thick client, we cannot sent it out to the pasture just yet. So if you have been avoiding the web client to this point, I have put together a nice introduction to vSphere Web Client to get you moving.
Introduction to vSphere Web Client
Upon visiting the link to the vSphere Web Client you are prompted with the common VMware login splash screen shown below. They are using this look in nearly all their products currently.
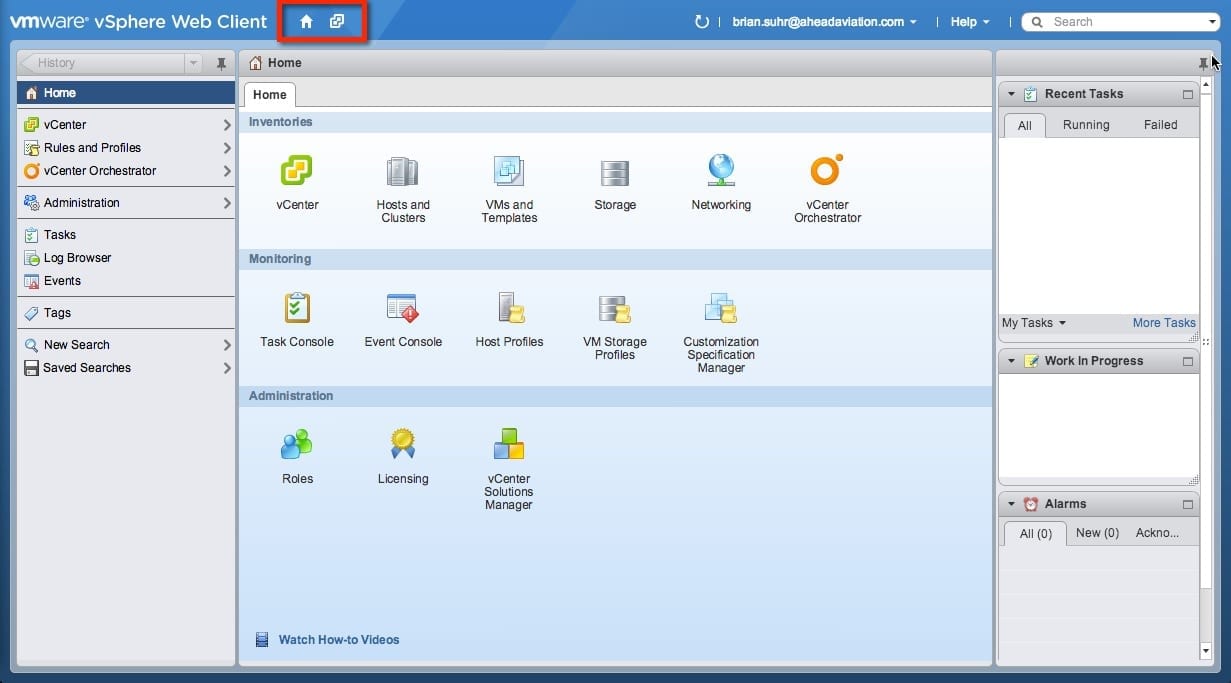
Hey, this sort of looks familiar, right? The initial look of the vSphere Web Client is not that far off from the classic client. You are presented with all the major icons and applications that you can access from the vCenter. This is pretty straightforward, so I won’t bore you on the specifics. But I did want to point out the top the two icons that I have highlighted in the image below. These will get you back to the home screen or the vCenter view from any place in the web client, so it makes it easy to return to the two most used areas.
vCenter Web Client Home View
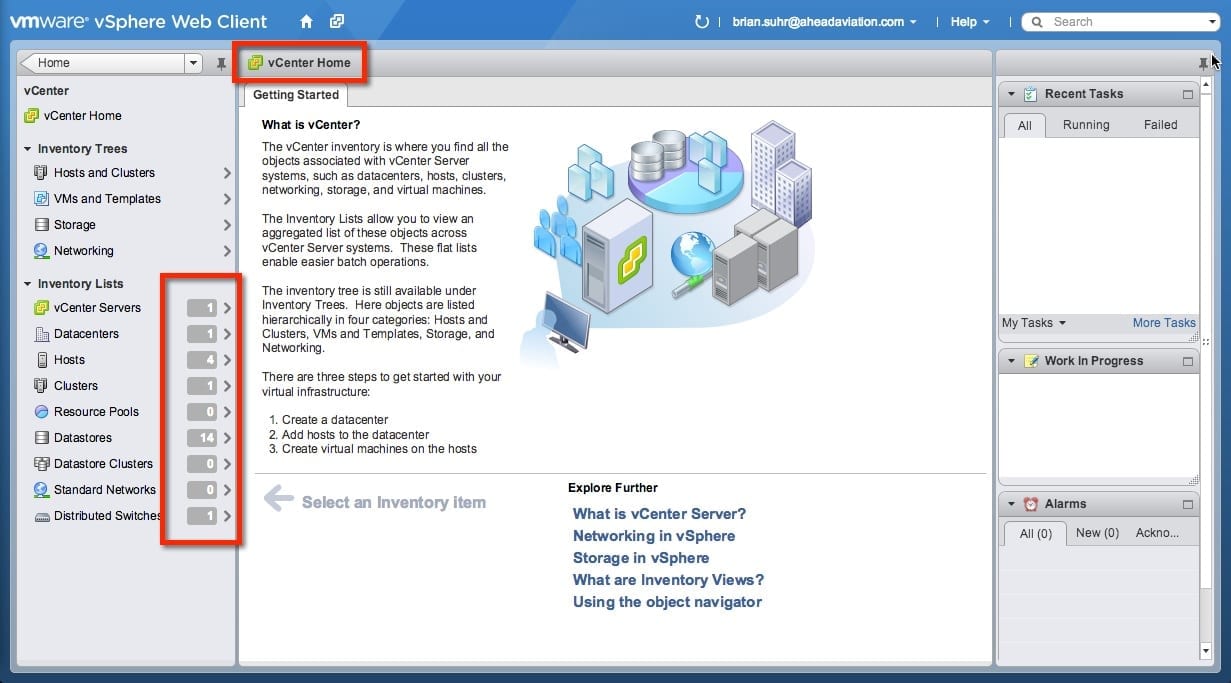
We are now looking at the vCenter Web Client home view in the image below. On the tree view on the left side, I have highlighted a nice summary of the inventory of the vCenter, which shows the counts for the major items in our environment. From this view we can easily move into the four main views that we are used to from the classic client (Hosts and Clusters, VMs, Storage, Networking). This may look different, but the terms and views are similar, so you should not have trouble adapting.
vSphere Web Client Host View
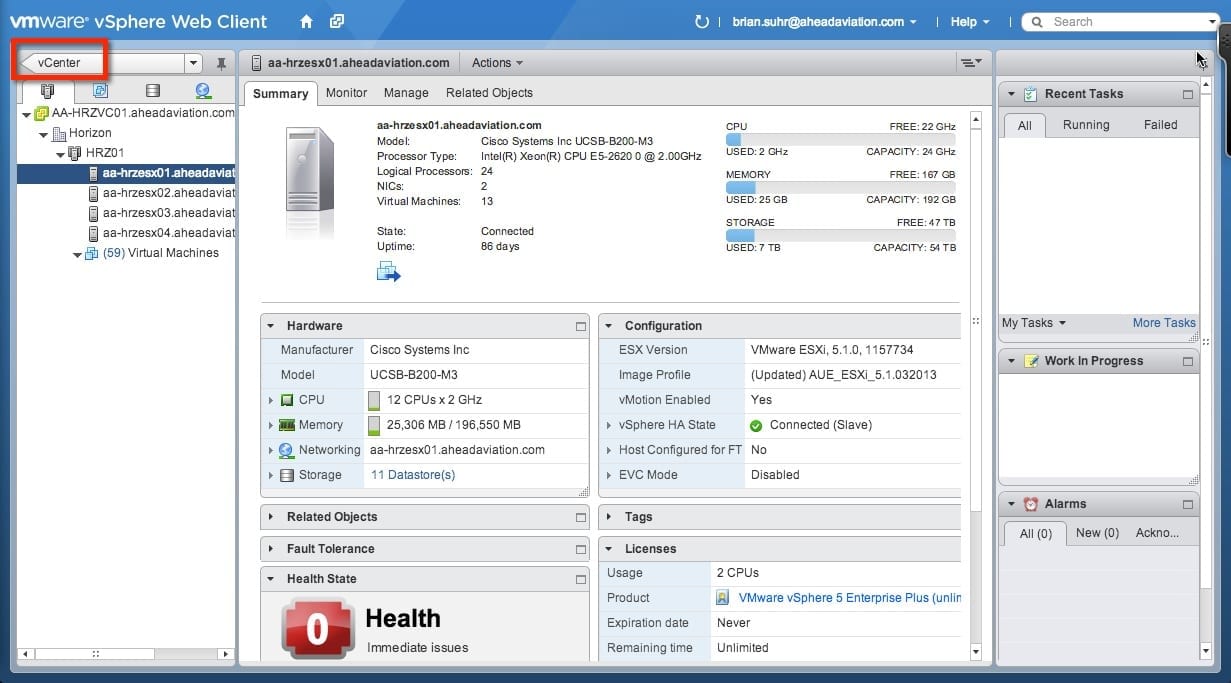
Next up, here’s what things look like when we want to view the information about one of our hosts. To do this, I have moved to the hosts and clusters view and selected one of the hosts in my single cluster. The image below shows all the details about this physical host. I have actually come to like this view more than the old client view. The data is presented in a nice manner, and the health section is one of my favorites.
In the Health section if you have vCOPs installed in your environment the data for the host is actually pushed into the web client. So from this view I can get a high-level idea on the health of this host without having to go over to vCOPs or dig into other performance charts.
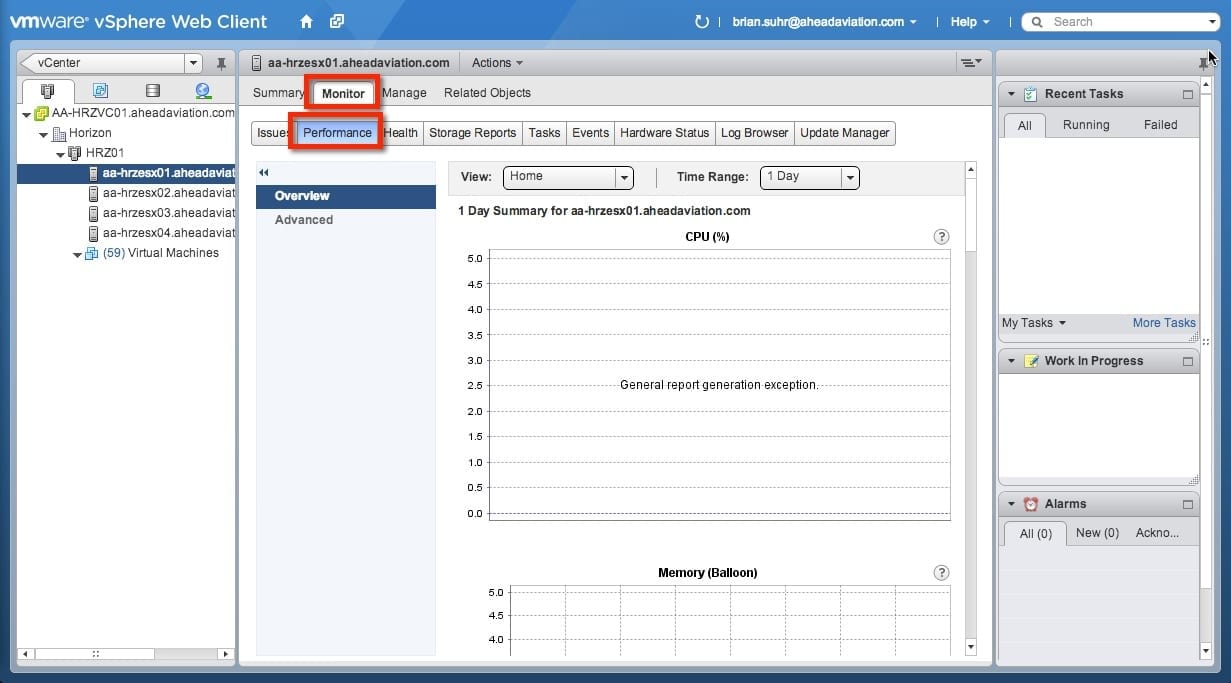
The next image shows that I’ve moved into the Monitor section for my host, and I’m looking at the performance area. From here you can look at the performance graphs that you’re used to seeing for vCenter in the classic client. You can also see all of the other tabs available under the monitor area to get an idea of other info that is at your fingertips.
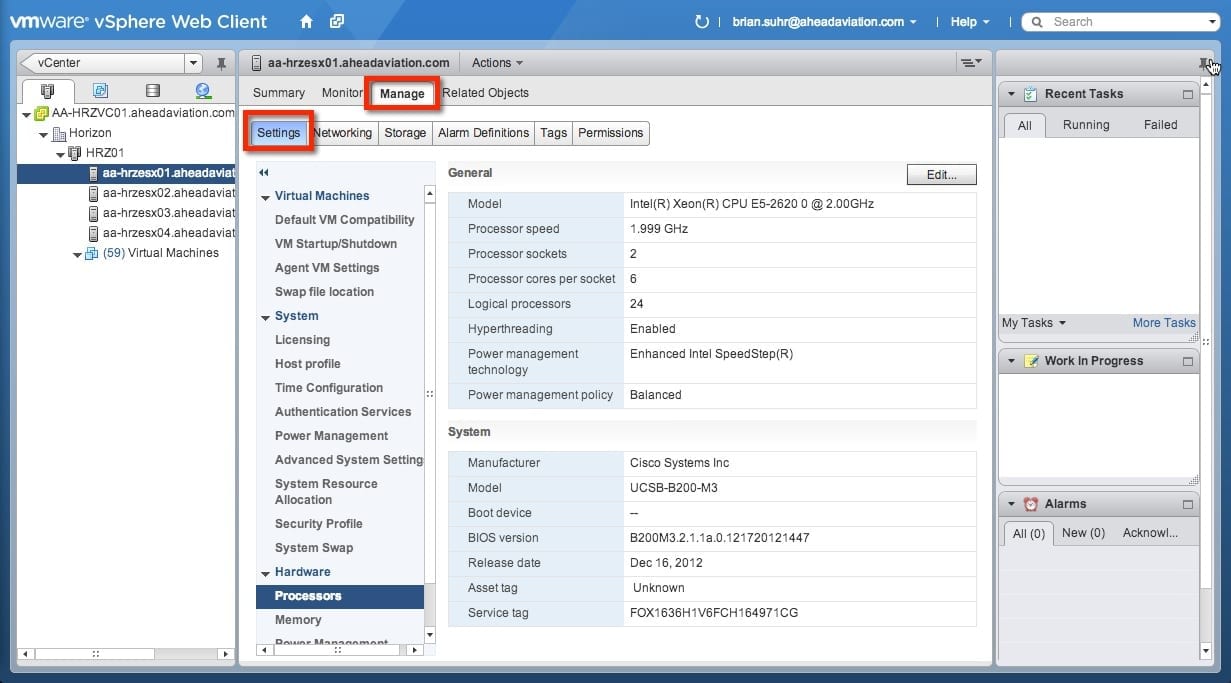
Last up in the host area, I’m looking at the Manage selection. From here I’m showing the settings, which should be familiar to those used to working with the classic client. This allows us to change host settings, licenses, and other settings.
VMs and Template View
Next up is the VM and Template view. Nothing radical here. We get a list of the VMs and our templates so that we can manage them. At the top of the tree, I have highlighted the view that we are using. We can easily jump between the main views by clicking on any of the other three icons.
One of my favorite new features is the integration of vCOPs data for the VMs. The health section is showing the health badges for the VM that we are looking at.
Storage View
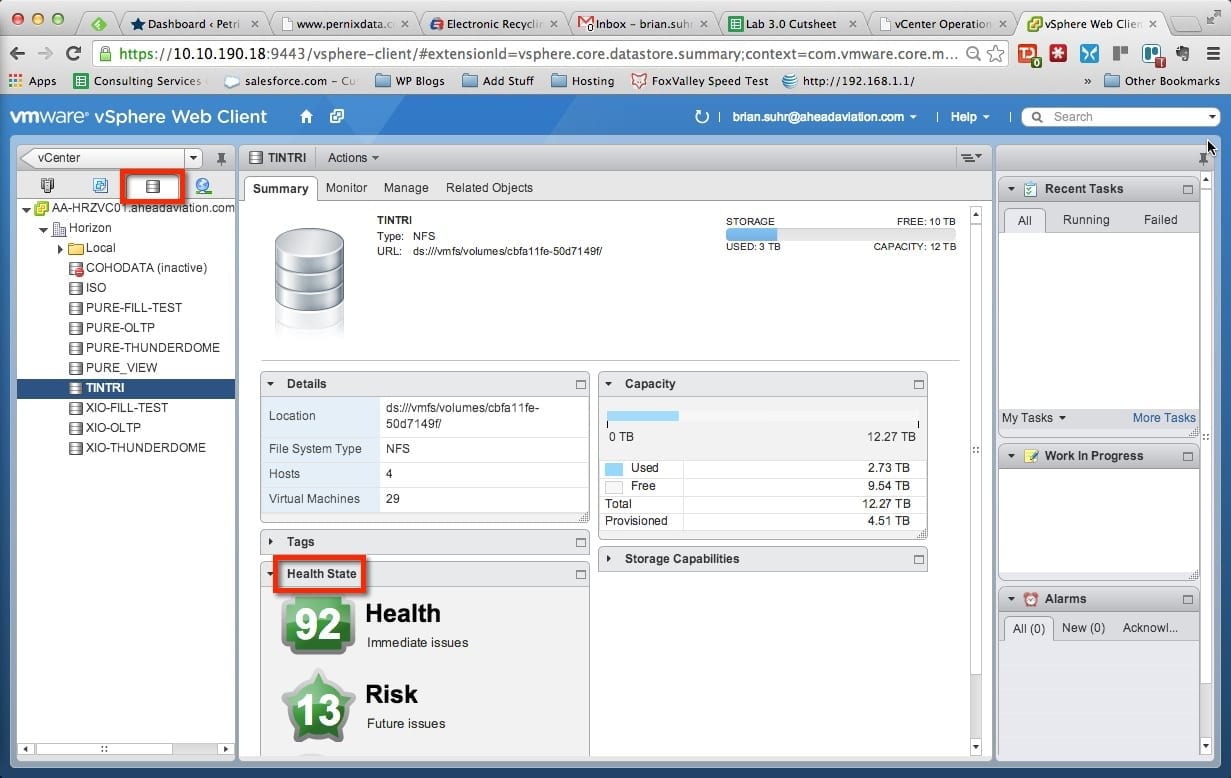
The Storage view shown below gives us an idea of the datastores for our environment. We get to see some nice info about each datastore and the health badges from vCOPs. Gotta love that vCOPs integration that we have seen throughout the areas.
Network View
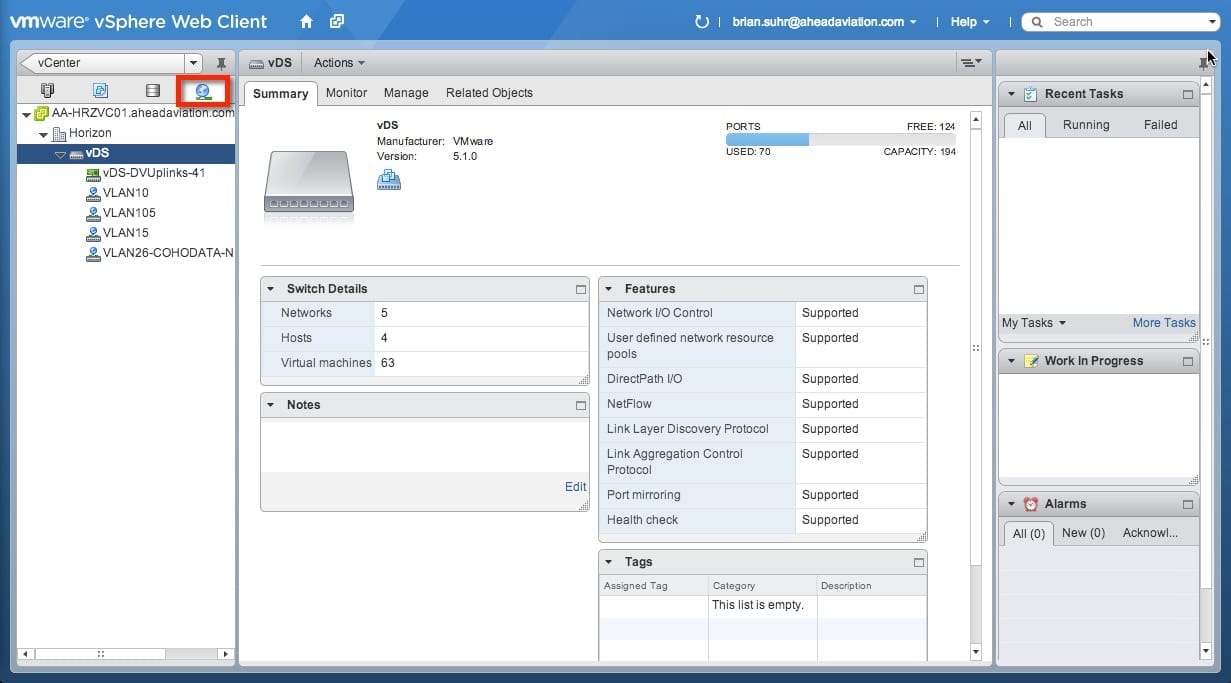
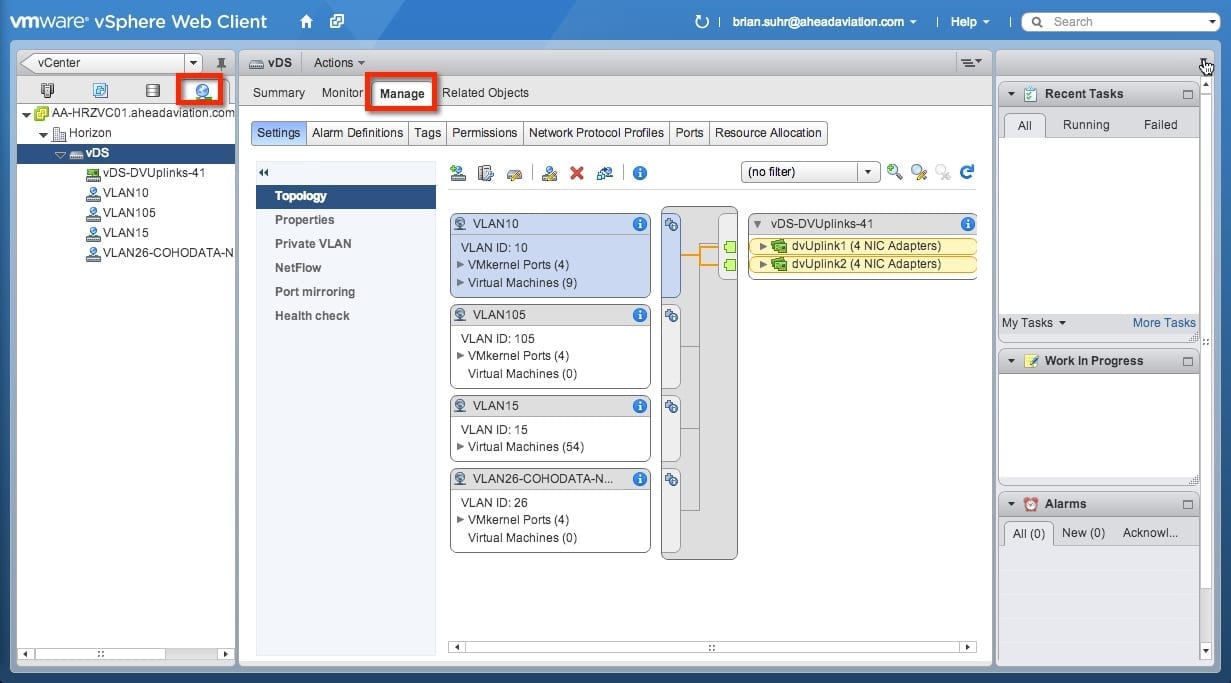
Now we have a look at the Network view of the web client. This allows us to look at and configure the virtual switches for a host or vCenter. In this view, the lab vCenter is configured with a single VDS switch. The view shows us some details and configuration for the VDS in an easy-to-consume manner. The tree view on the left is very close to what you would have seen in the classic client.
The next image shows that I’ve moved to the Manage tab to look at the configuration of the VDS. I’m looking at the settings tab that shows the common vswitch layout view that you would have seen in the past. The other tabs allow for configuration of the traditional network items and features.
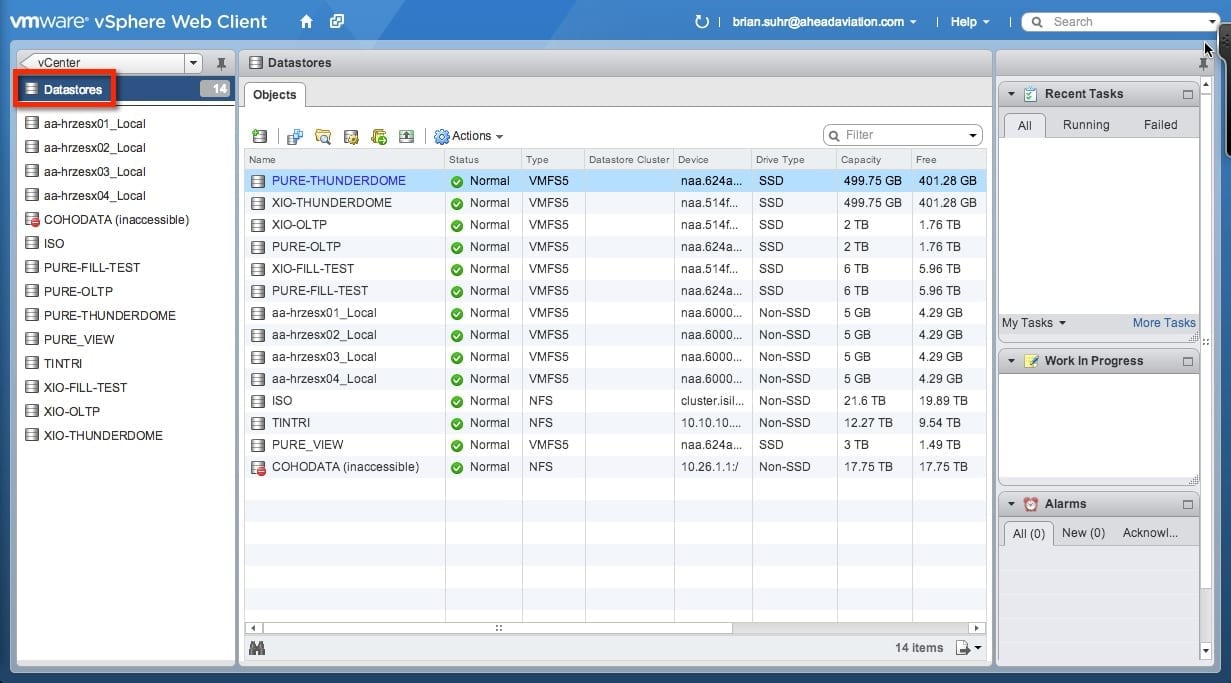
One of My Favorites: Datastores View
To wrap up things, I thought that I would show one of my favorite views for vSphere Web Client. As an admin, I remember having to manage capacity of datastores and looking for a good view for this. The Datastores view shown below presents a lot of data to the admin about the storage configured within this vCenter.
I hope this has helped you get to know the vSphere Web Client better, and that you start to use it more often. There is no avoiding it forever, so the sooner you start using it as your main point of access the better!


