If you have been a VMware admin for any period of time you have probably heard about esxtop, or maybe you have had really good luck and never needed it. Either way, I’ll go ahead and explain what esxtop is. But my real focus today is learning how to use the VisualEsxtop Fling from VMware labs, including how to install and run VisualEsxtop. This new tool brings a GUI to the popular command line tool.
[Editor’s note: VMware “Flings” are side projects by VMware Labs that are “…apps and tools built by our engineers that are intended to be played with and explored.” Learn more in this previous Petri article about VMware Flings.]
What Is Esxtop?
To make this as simple and clear as possible, esxtop is a command line-based tool from VMware. It is a very important tool for troubleshooting and gathering information about your environment. I’ve quoted a more detailed description below from the VMware site:
“Esxtop allows monitoring and collection of data for all system resources: CPU, memory, disk and network. When used interactively, this data can be viewed on different types of screens; one each for CPU statistics, memory statistics, network statistics and disk adapter statistics. In addition to the disk adapter statistics in earlier versions, starting with ESX3.5, disk statistics at the device and VM level are also available. In the batch mode, data can be redirected to a file for offline uses.”
What Is VisualEsxtop?
VisualEsxtop is a creation from the internal VMware engineers that was released to the public via VMware Labs. This brings a Java-based GUI to the esxtop tool to make it easier to use for some users and adds some additional functionality.
Here is a short list of some of the new or simplified functions that VisualEsxtop brings to this important tool.
- Live connection to ESX host or vCenter Server
- Flexible way of batch output
- Easy to run batch mode to record stats for a period of time
- Load batch output and replay them
- Multiple windows to display different data at the same time
- Line chart for selected performance counters
- Flexible counter selection and filtering
- Embedded tooltip for counter description
- Color coding for important counters
- Columns include a metric definition pop-up. This is huge for new users.
How to Install VisualEsxtop on Windows or Linux (or Even Mac!)
The good news is the tool is pretty simple to install. You first need to download the tool from the VMware Labs site. Once you have the file, follow the steps below and you will be running in no time.
- Download visualEsxtop.zip and unzip the file.
- Make sure Java 1.6 is in the PATH.
- If loading large amounts of data, type:
export JAVA_OPTS=-Xmx2048m - For Linux, run:
visualEsxtop.sh - For Windows, run:
visualEsxtop.bat
The above instructions cover how to run VisualEsxtop if you are a Windows or Linux user, but what about us Apple users? The good news is that blogger William Lam worked his usual powers and created a tutorial on how to how to run VMware VisualEsxtop on Mac OS X.
How to Run VisualEsxtop
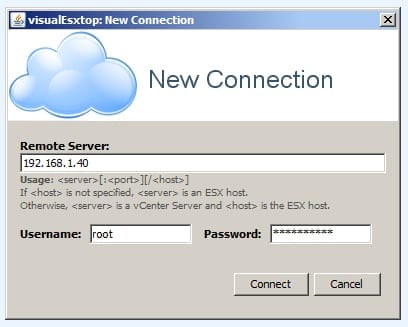
First thing to do once launching the application is to choose an endpoint to which to connect. You can either connect directly to a vSphere host or a vCenter server. For the purpose of this demo, I connected directly to a single ESXi host.
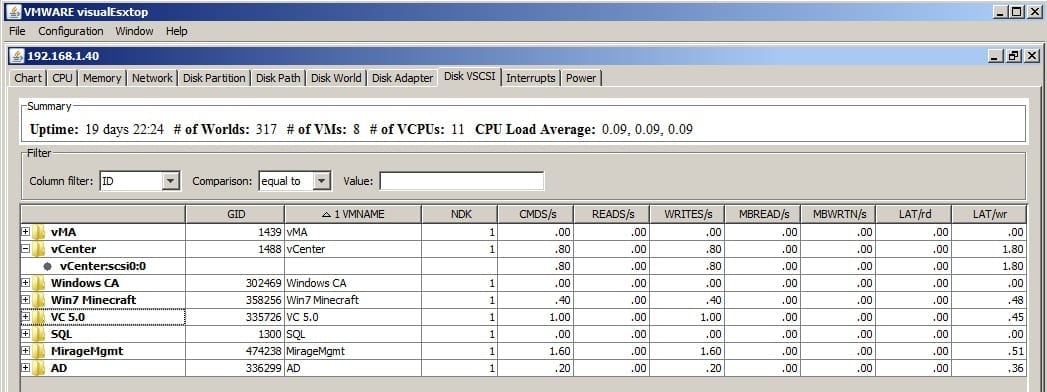
Once connected, you can look at a variety of available stats at the host level to a per VM-based level. This offers many different views into the performance of your environment. There are 11 tabs across the top of the window to allow you to view the different stats.


