In recent posts I’ve covered the vCenter server appliance and the vSphere Web Client. These products are the future of vSphere management and the sooner people get up to speed, the better. In this post I will cover the new storage reporting options in vSphere web client.
Storage Reports in vSphere Web Client
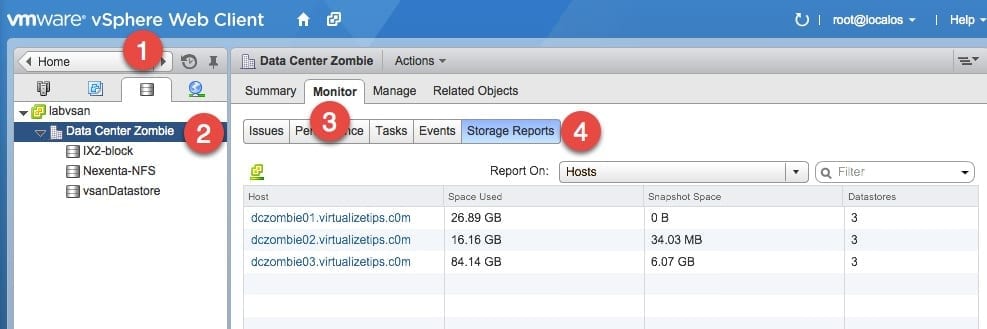
First off: How do you find these new storage reports? Open the vSphere web client and click on the Storage icon as shown in Step 1 in the image below. Then click on the data center or a datastore per Step 2. Select the Monitor tab and then the Storage Reports button.
This initial report is focused on Host related data. The type of report can be selected from the Report On drop-down list. The host report gives a good bit of data that shows the following details.
- Host list – In this example, this shows all hosts in the data center that I selected.
- Space used – How much space are the VMs consuming on a per host view.
- Snapshot Space – If VMs have snapshots, and how much space does that consume on a per-host view.
- How many datastores are connected to each host.
These are some helpful stats that could be useful in many different reporting or troubleshooting scenarios.

In this next example I have switched my report from a host-based view to a datastore-based view. This allows me to look at information on a per datastore for a different view of the environment. From this view, I can look at details like the following list.
- Datastore list – A simple inventory list of all datastores in your vCenter.
- Datastore Cluster – Does the datastore belong to a datastore cluster?
- File system – Easily figure out whether the datastore is block (VMFS), NAS (NFS), or VSAN.
- Multipathing status – Are there any issues or warnings with the storage paths?
- Space details – View details on total space, free space, and space used.
- Snapshot space – View how much capacity is used by snapshots on the given datastore.
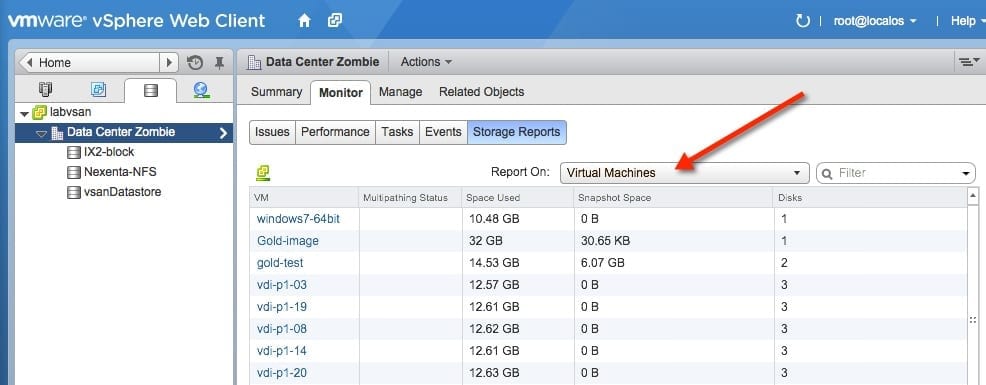
For the last example, the storage report has been switched to a virtual machine based view on the storage. By now you are seeing the pattern here, so the report views can be switched so that you can choose how you want to view information. The virtual machine view shows a listing of VMs, space used, and snapshot details. It also shows a count of number of disks per VM, which might be helpful in some circumstances.
Other Reports Available on vSphere Web Client
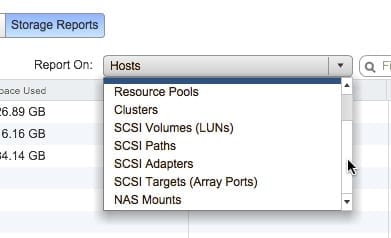
There are still a number of other reports available in these storage reports, though I will not put you through the pain of explaining each one. I have captured a list of the other options that are available in the image below. These other options focus on some specific details on the storage level.
The storage reporting feature is just another of the simple little additions that VMware continues to build into the new version of vSphere web client. Continue to follow Petri IT Knowlegebase for more details on other features.


