


M365 Changelog: (Updated) Quick Create – Easily Create Power BI Reports from Lists
MC248201 – Updated July 8, 2022: Microsoft has updated the rollout timeline below for Government organizations. Thank you for your patience.
Microsoft is excited to announce the arrival of a new guided authoring experience in Lists that will make it easy to quickly create business intelligence reports in Power BI using your list schema and data.
Key points
- Microsoft 365 Roadmap ID 72175.
- Timing:
- Targeted Release: rolling out in early early May. – Completed
- Standard Release: rolling out from early June (previously late May) to mid-July (previously early June). – Completed
- Government: Microsoft will begin rolling out in early August (previously early July) and expect to complete by mid-August (previously mid-July).
- Roll-out: tenant level
- Control type: admin control
- Action: review and assess
How this will affect your organization
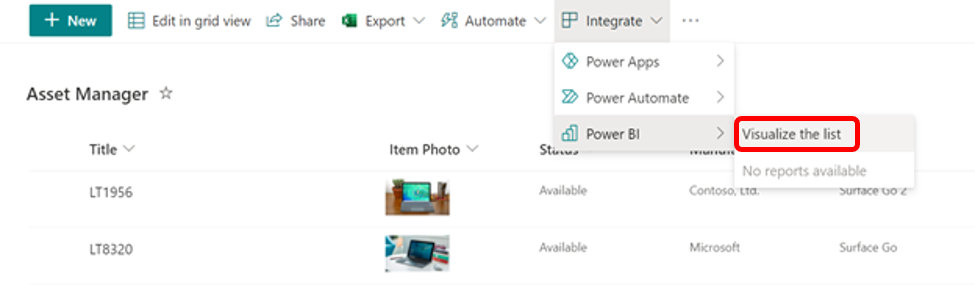
List users will see a new menu option in Integrate > Power BI > Visualize this list, which allows users to create a new Power BI report using that list. With just one click, you’ll be able to autogenerate a basic report and customize the list columns that are shown in the report. To take further advantage of Power BI’s advanced data visualization capabilities, just go into Edit mode. Once a report is saved and published, it will appear in the same submenu under Integrate> Power BI.
- Users with a Microsoft 365 E5 license or Power BI Pro license will have access to the full report authoring and viewing experience.
- Users without either of the above licenses will be prompted by Power BI to sign up for a 60-day free trial of Power BI Pro when they attempt to save a new report or edit or view an existing report. To turn off self-service sign-up so that the option for a trial is not exposed to List users, click here.
- Users with a Power BI free license may only visualize their list data, but cannot publish nor view reports.
What you need to do to prepare
This feature is default on, but can turned off from the Power BI Admin Portal under Tenant settings.
If this feature is disabled for tenants, users will continue to see the Power BI submenu in the List command bar, but any attempt to create or view a report will result in an error page.
Note:
Certain complex column types in Lists such as Person, Location, Rich Text, Multi-select Choice, and Image are not currently supported when the Power BI report is autogenerated.
Learn more: